Power Trades Scanner
Orderflow Analysis allow you to understand the causes of price movement, clarify and confirm support and resistance levels, as well as assess the imbalance between buyers and sellers. But volume tools are link to a specific time (timeframe), not allowing to see an execution of large orders at the moment.
Using Power Trades you can see the execution of a large number of orders in a very short time, which will affect the price change with a high probability.
What does Power Trades show?
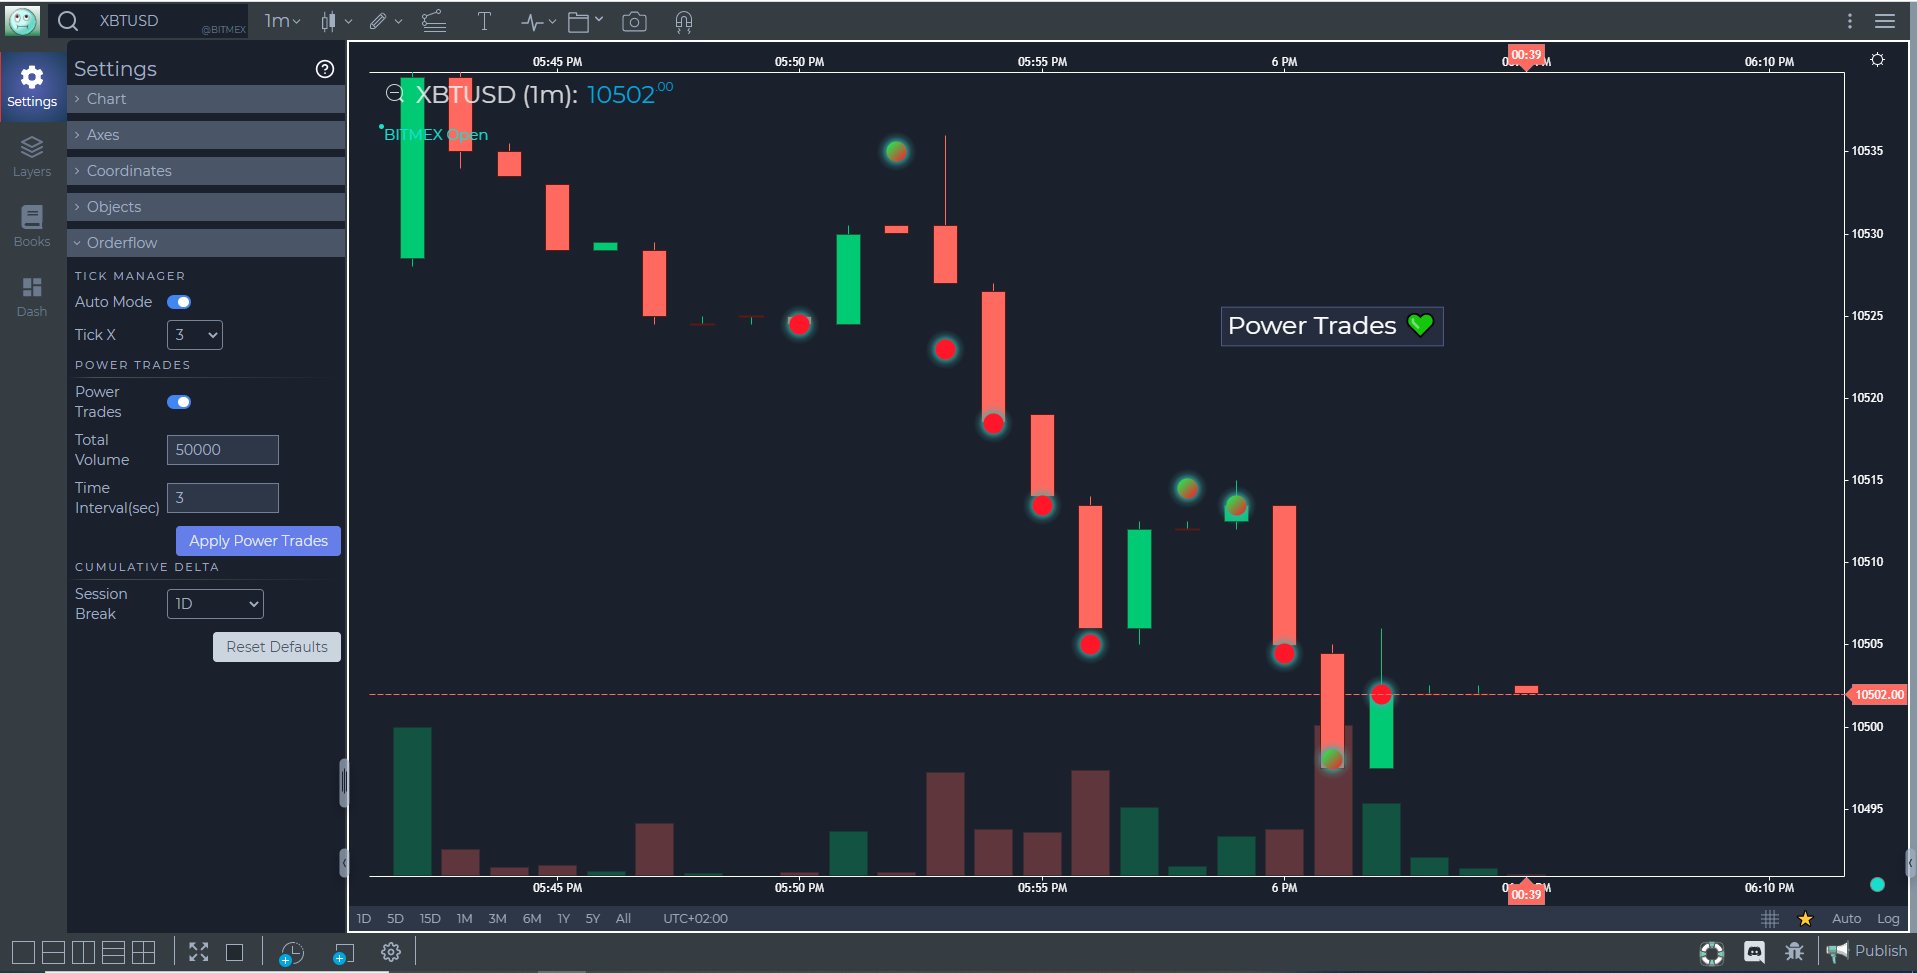
The scanner searches for zones with high volumes of trades in very short span of time (say within 3 seconds). They precede change in ratio of supply/demand. These trades are shown as bubbles on the Price Chart.
There is a continuous process of placing, changing and executing orders in the market. All this affects the price change and the expectations of traders regarding the future price. When a large order appears at a certain level, the price is more likely to come to this order and it will be executed because the market is always looking for levels with liquidity. This already applies to the order flow and the mechanics of orders matching, so we will omit the principles on which the orders are matched. It is only important to understand that “abnormal events” occur in the market at certain times. Execution of a significant volume of orders in a very short time is one of such events.
How to activate Power Trades Scanner
Power Trades Scanner can be activated from the General Settings Dialogue under Orderflow section
Power Trades Switch
Turn the switch ON to allow the algorithm start loading the scanner
Total Volume
Enter the volume you want to filter as a Power Trade during LIVE market hours
Time Interval (in Sec)
The period of time within which scanner will search for a cumulative volume traded greater than or equal to the Total Volume filter entered above
Now click on APPLY POWER TRADES button and enjoy the ride
