Text and Shapes
Introduction
You may display text or shapes using five different ways with Lipi Script:
plotchar()plotshape()plotarrow()
Which one you should use depends on your needs:
-
Three functions can display pre-defined shapes:
plotshape(),plotarrow(). -
The
plotarrow()function cannot display text; it can only display up or down arrows. -
The
plotchar()andplotshape()functions can display non-dynamic text on any bar or all bars of the chart. -
The
plotchar()function can only display a single character, whileplotshape()can display strings, including line breaks. -
While
plotchar()andplotshape()_can display text at a fixed offset in the past or future—an offset that cannot change during the script’s execution.
These are a few things to keep in mind concerning Lipi Script strings:
-
_The
textparameter in bothplotchar()andplotshape()requires a constant string (const string) argument. Therefore, it cannot include values like prices that are only available at runtime as a series string (series string). -
The concatenation operator for strings in Lipi is
+. It is used to join string components into one string, e.g.,msg = "Chart symbol: " + syminfo.tickerid(wheresyminfo.tickeridis a built-in variable that returns the chart’s exchange and symbol information in string format). -
_Characters displayed by all these functions can be Unicode characters, including Unicode symbols.
-
The color or size of text can sometimes be controlled using function parameters, but no inline formatting (bold, italics, monospace, etc.) is possible.
-
Text from Lipi scripts always displays on the chart in the Trebuchet MS font, which is used in many Gocharting texts, including this one.
plotchar()
This function is useful to display a single character on bars. It has the following syntax:
plotchar(series, title, char, location, color, offset, text, textcolor, size) → voidWithout affecting the scale, the function can be used to display and inspect values in the Data Window or in the indicator values displayed to the right of the script’s name on the chart:
indicator("", "", true)
plotchar(bar_index, "Bar index", "", location.top)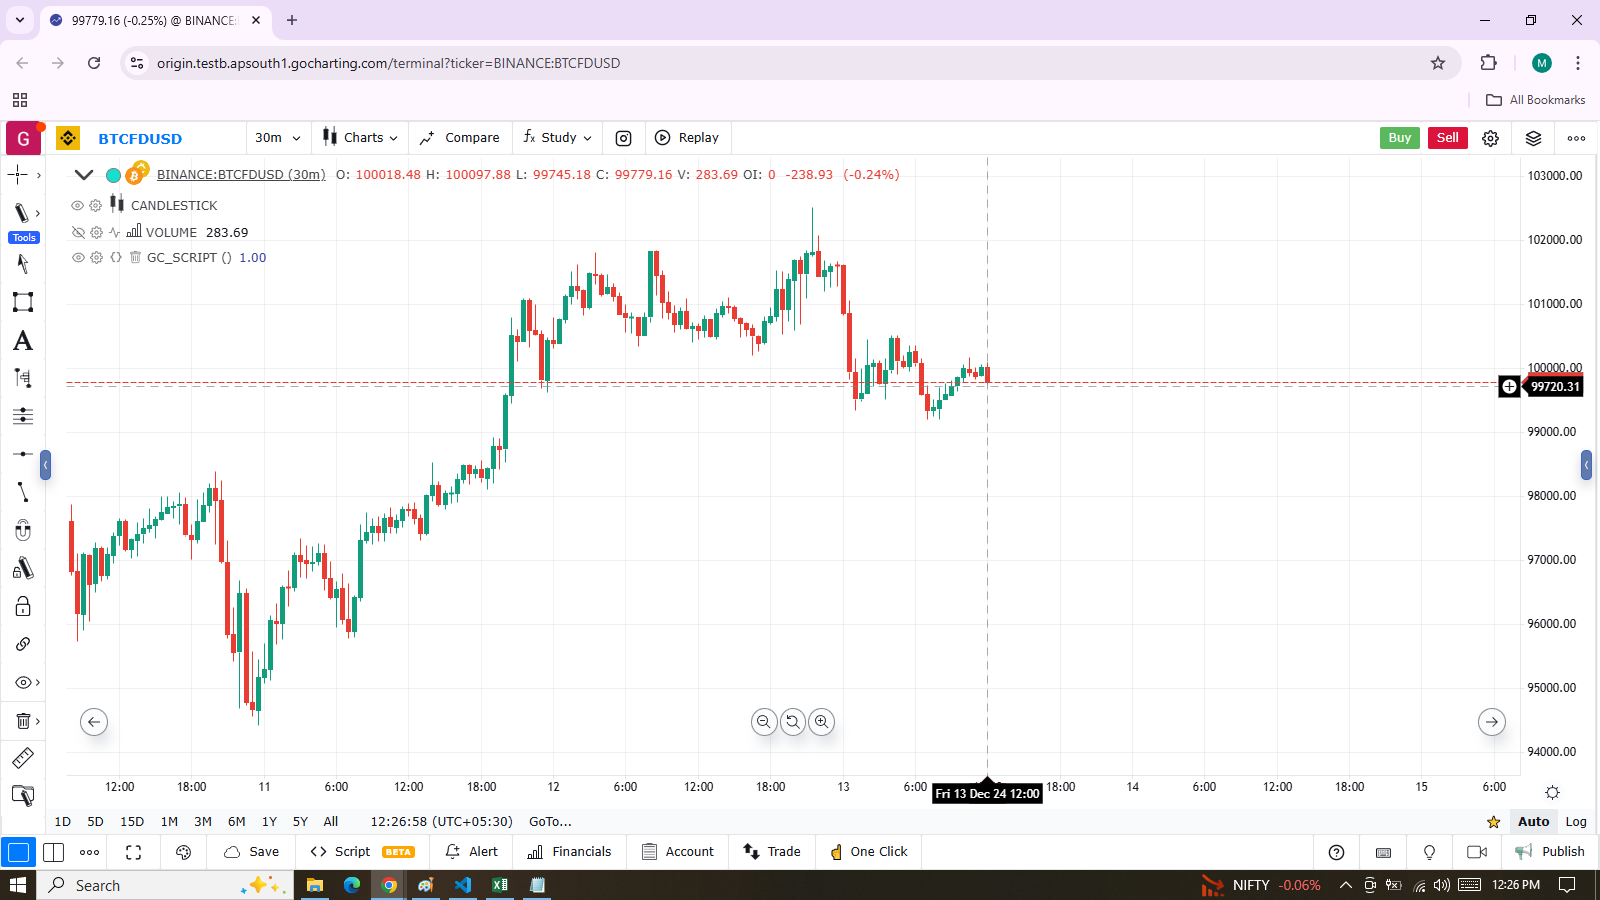
Notes:
- The cursor is positioned on the chart’s last bar.
- The value of
bar_indexon that bar is displayed in the indicator values (1) and in the Data Window (2). - We use
location.topbecause the defaultlocation.abovebarwould place the price in the script’s scale, often interfering with other plots.
plotchar() is also useful for identifying specific points on the chart or for validating that conditions are true at the expected times. This example displays an up arrow under bars where the close, high, and volume have all been rising for two consecutive bars:
indicator("", "", true)
bool longSignal = talib.rising(close, 2) and talib.rising(high, 2) and (na(volume) or talib.rising(volume, 2))
plotchar(longSignal, "Long", "▲", location.belowbar, color = na(volume) ? color.gray : color.blue, size = size.tiny)
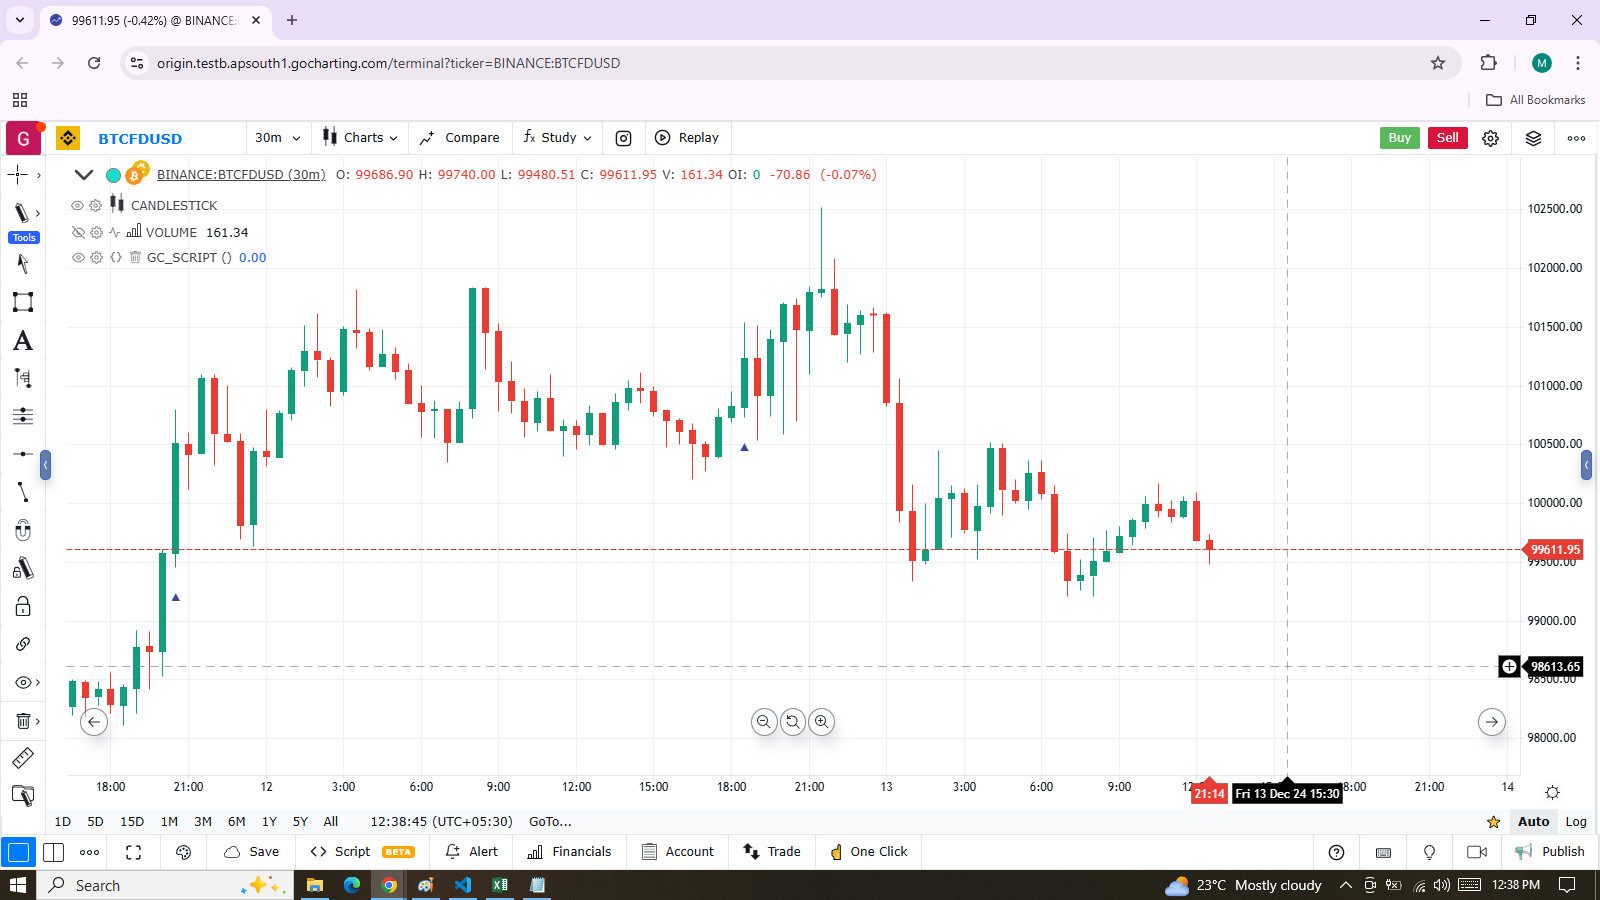
Notes:
- We use
(na(volume) or talib.rising(volume, 2))so that our script works on symbols without volume data. If we did not account for cases where there is no volume data, asna(volume)does (which is true when no volume is available), thelongSignalvariable would never be true becausetalib.rising(volume, 2)would yield false in those cases. - We display the arrow in gray when there is no volume to remind us that all three base conditions are not being met.
- Since
plotchar()is now displaying a character on the chart, we usesize = size.tinyto control its size. - We have adapted the
locationargument to display the character under bars. - If you don’t mind plotting only circles, you could also use
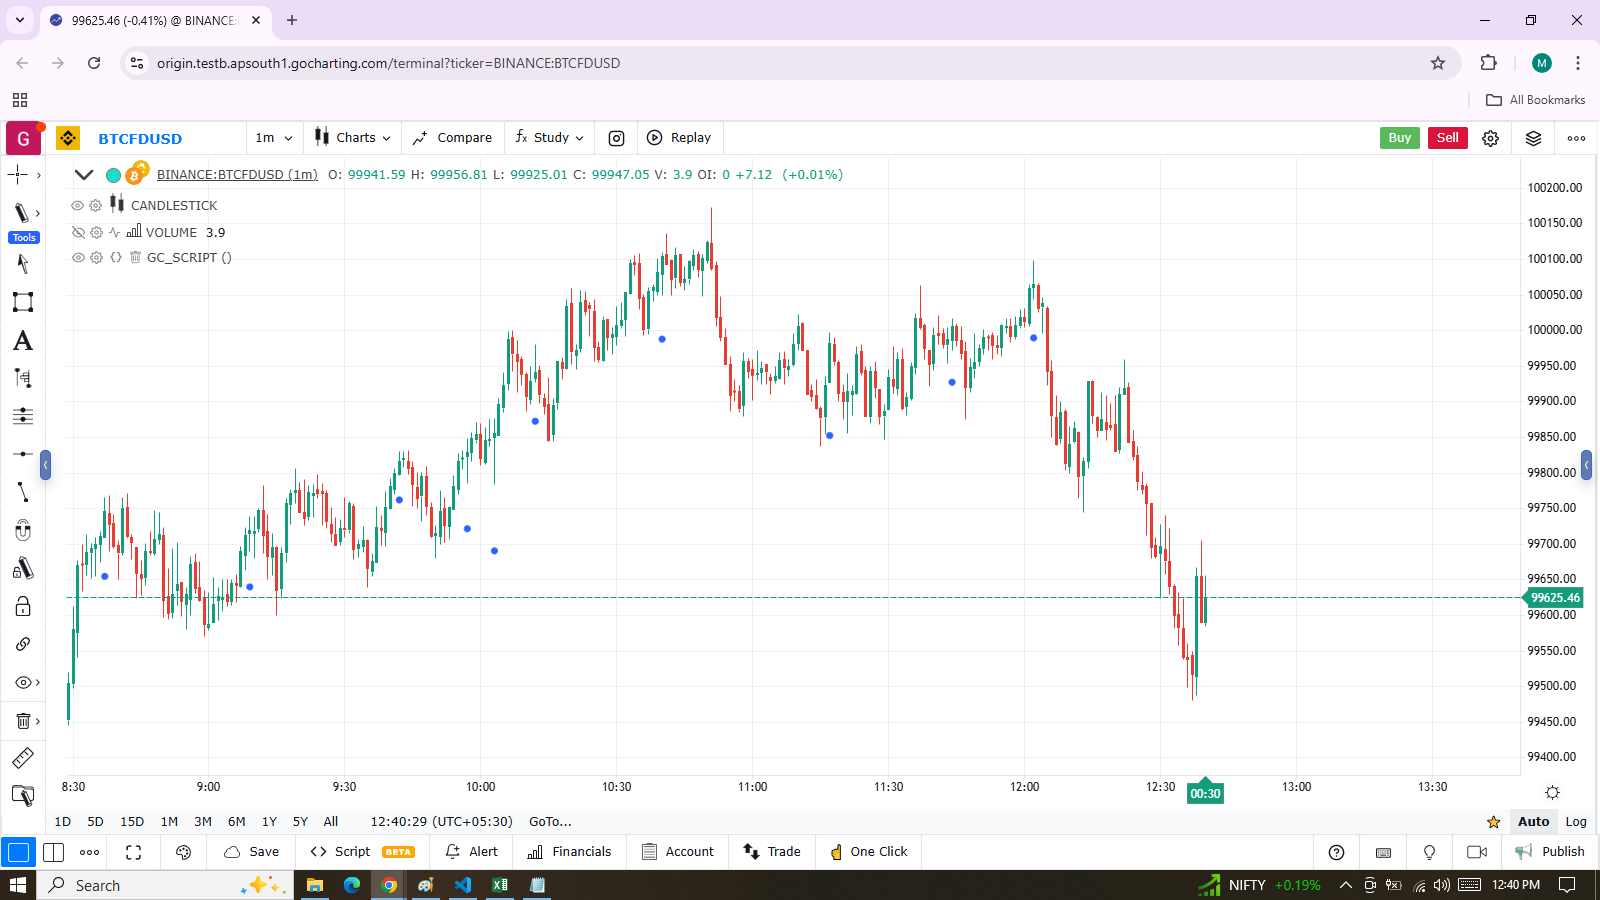
plot()to achieve a similar effect:
indicator("", "", true)
longSignal = talib.rising(close, 2) and talib.rising(high, 2) and (na(volume) or talib.rising(volume, 2))
plot(longSignal ? low - talib.tr() : na, "Long", color.blue, 2, plotStyle.scatter)
This method has the inconvenience that, since there is no relative positioning mechanism with plot() one must shift the circles down using something like talib.tr (the bar’s “True Range”):
plotshape()
This function is used to display pre-defined shapes and/or text on bars. It has the following syntax:
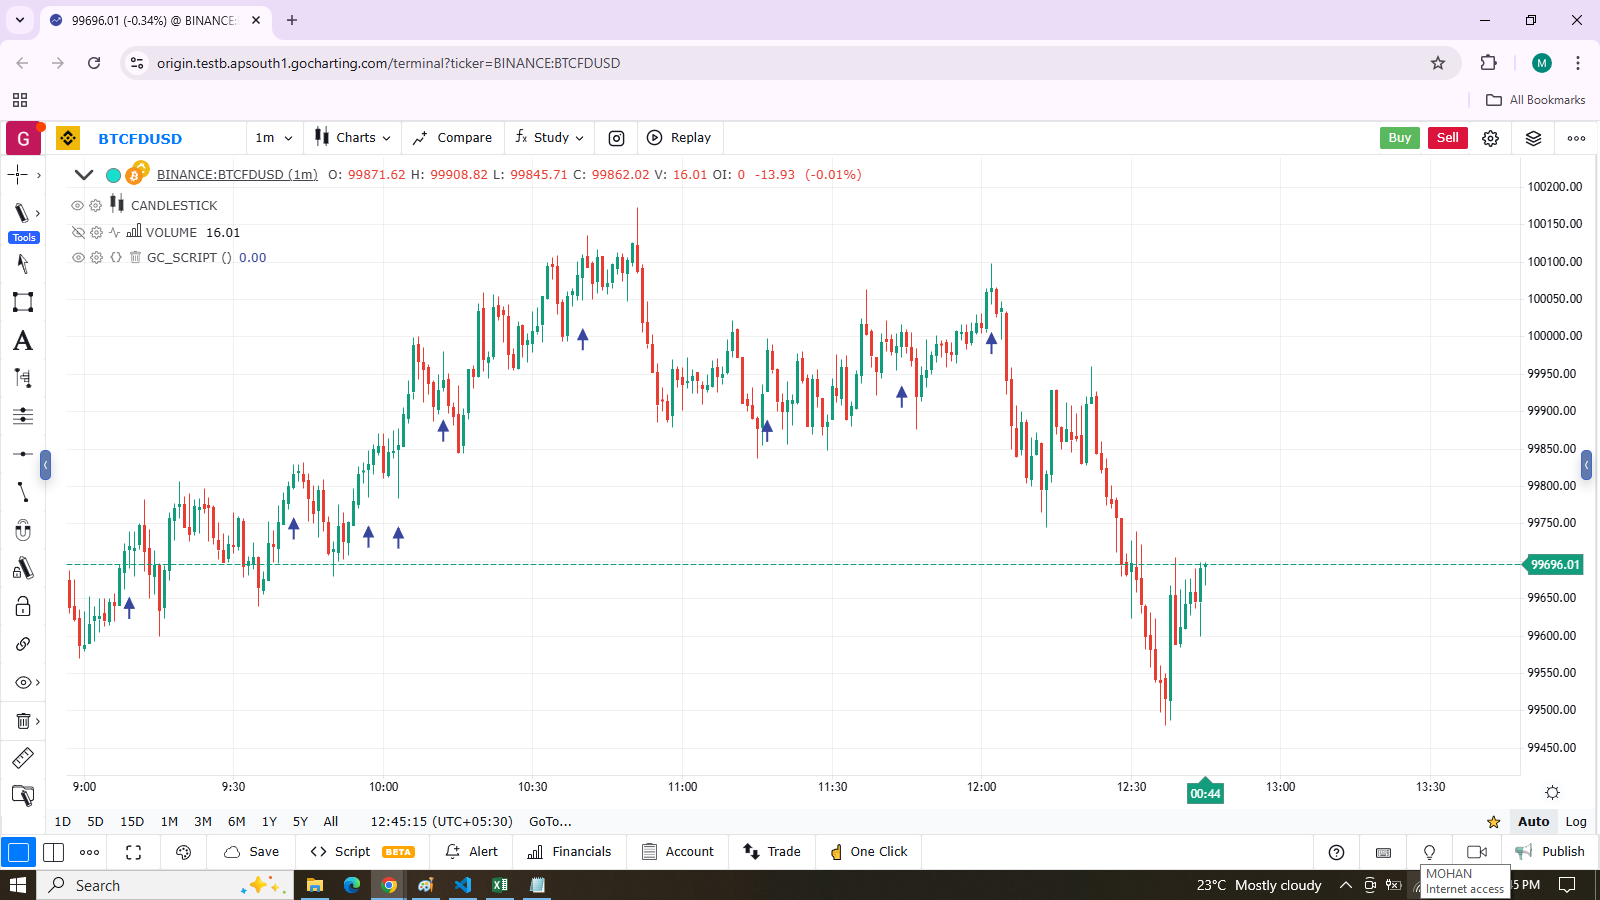
plotshape(series, title, shape, location, color, offset, text, textcolor, size) → voidLet’s use the function to achieve more or less the same result as with our second example of the previous section:
indicator("", "", true)
longSignal = talib.rising(close, 2) and talib.rising(high, 2) and (na(volume) or talib.rising(volume, 2))
plotshape(longSignal, "Long", shape.arrowup, location.belowbar)
Note:
Here, instead of using an arrow character, we are using the shape.arrowup argument for the style parameter.
It is possible to use different plotshape() calls to superimpose text on bars. To preserve the functionality of the newline, you must use \n followed by a special non-printing character that doesn’t get stripped out. Here, we are using a Unicode Zero-width space (U+200E). While you won’t see it in the following code’s strings, it is there and can be copied/pasted. The special Unicode character must be the last one in the string for text going up, and the first one when plotting under the bar with text going down.
//
indicator("Lift text", "", true)
plotshape(true, "", shape.arrowup, location.abovebar, color.green, text = "A")
plotshape(true, "", shape.arrowup, location.abovebar, color.lime, text = "B\n")
plotshape(true, "", shape.arrowdown, location.belowbar, color.red, text = "C")
plotshape(true, "", shape.arrowdown, location.belowbar, color.maroon, text = "\nD")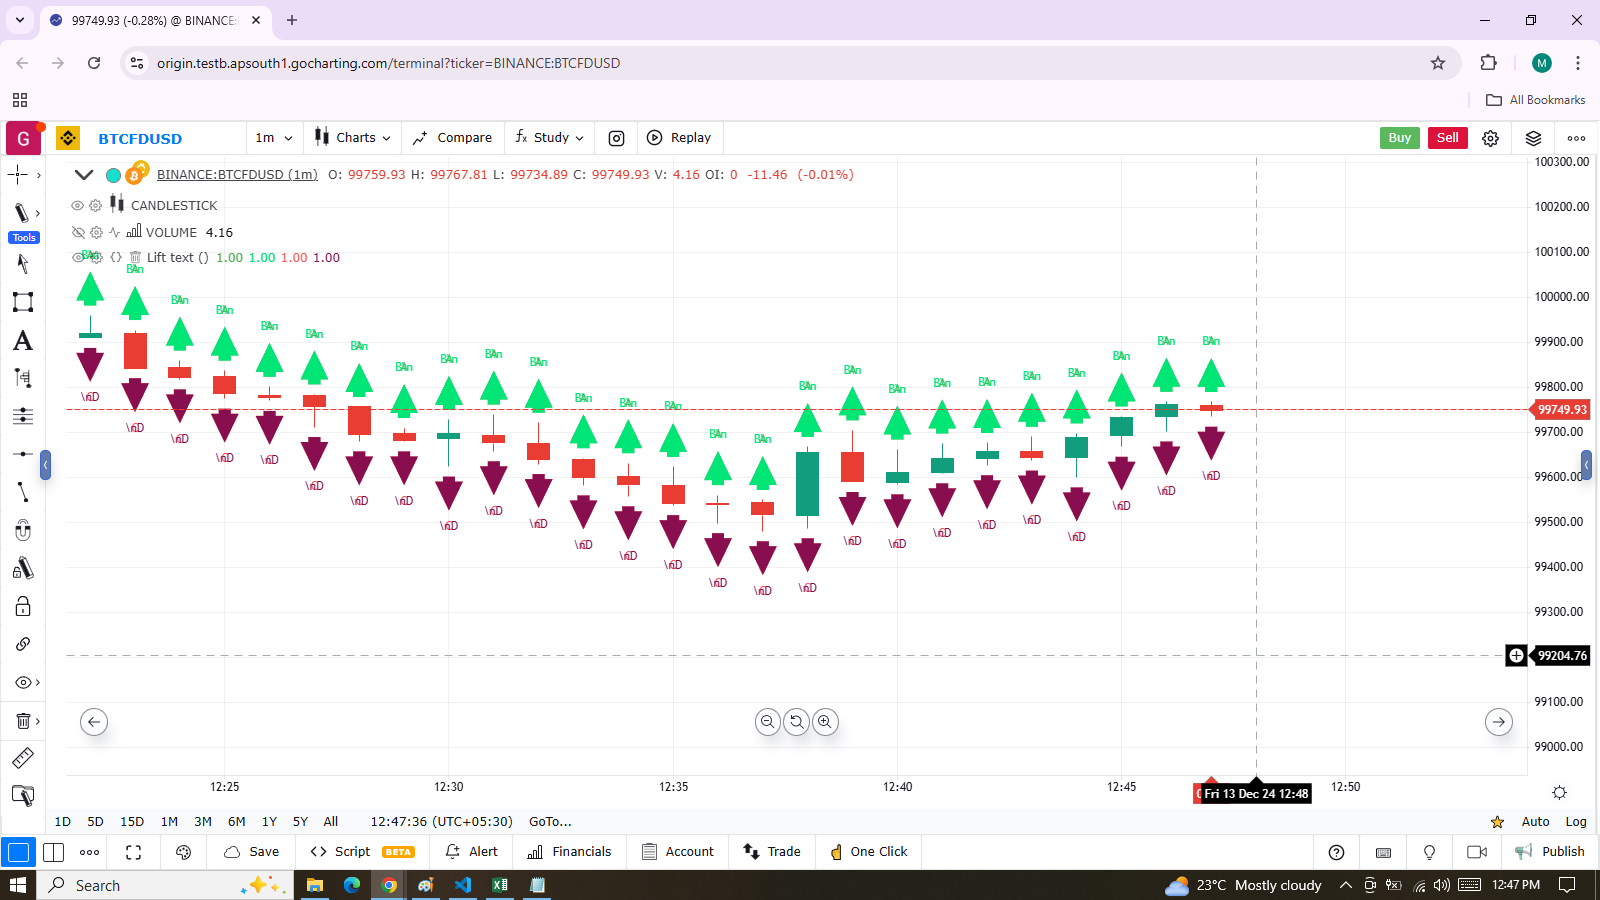
The available shapes you can use with the style parameter are:
| Argument | Shape | With Text | Argument | Shape | With Text |
|---|---|---|---|---|---|
shape.xcross |  | shape.arrowup |  | ||
shape.cross |  | shape.arrowdown |  | ||
shape.circle |  | shape.square |  | ||
shape.triangleup |  | shape.diamond |  | ||
shape.triangledown |  | shape.labelup |  | ||
shape.flag |  | shape.labeldown |  |
plotarrow()
The plotarrow() function displays up or down arrows of variable length, depending on the relative value of the series used in the function’s first argument. It has the following syntax:
plotarrow(series, title, colorup, colordown, offset, minheight, maxheight) → voidThe series parameter in plotarrow() is not a “series bool” like in plotchar() and plotshape(); it is a “series int/float” and involves more than just a simple true or false value to determine when the arrows are plotted. This is the logic governing how the argument supplied to the series affects the behavior of plotarrow():
series > 0: An up arrow is displayed, with the length proportional to the relative value of the series on that bar in relation to other series values.series < 0: A down arrow is displayed, proportionally sized using the same rules.series == 0 or na(series): No arrow is displayed.
The maximum and minimum possible sizes for the arrows (in pixels) can be controlled using the minheight and maxheight parameters.
Here is a simple script illustrating how plotarrow() works:
indicator("", "", true)
body = close - open
plotarrow(body, colorup = color.yellow, colordown = color.red)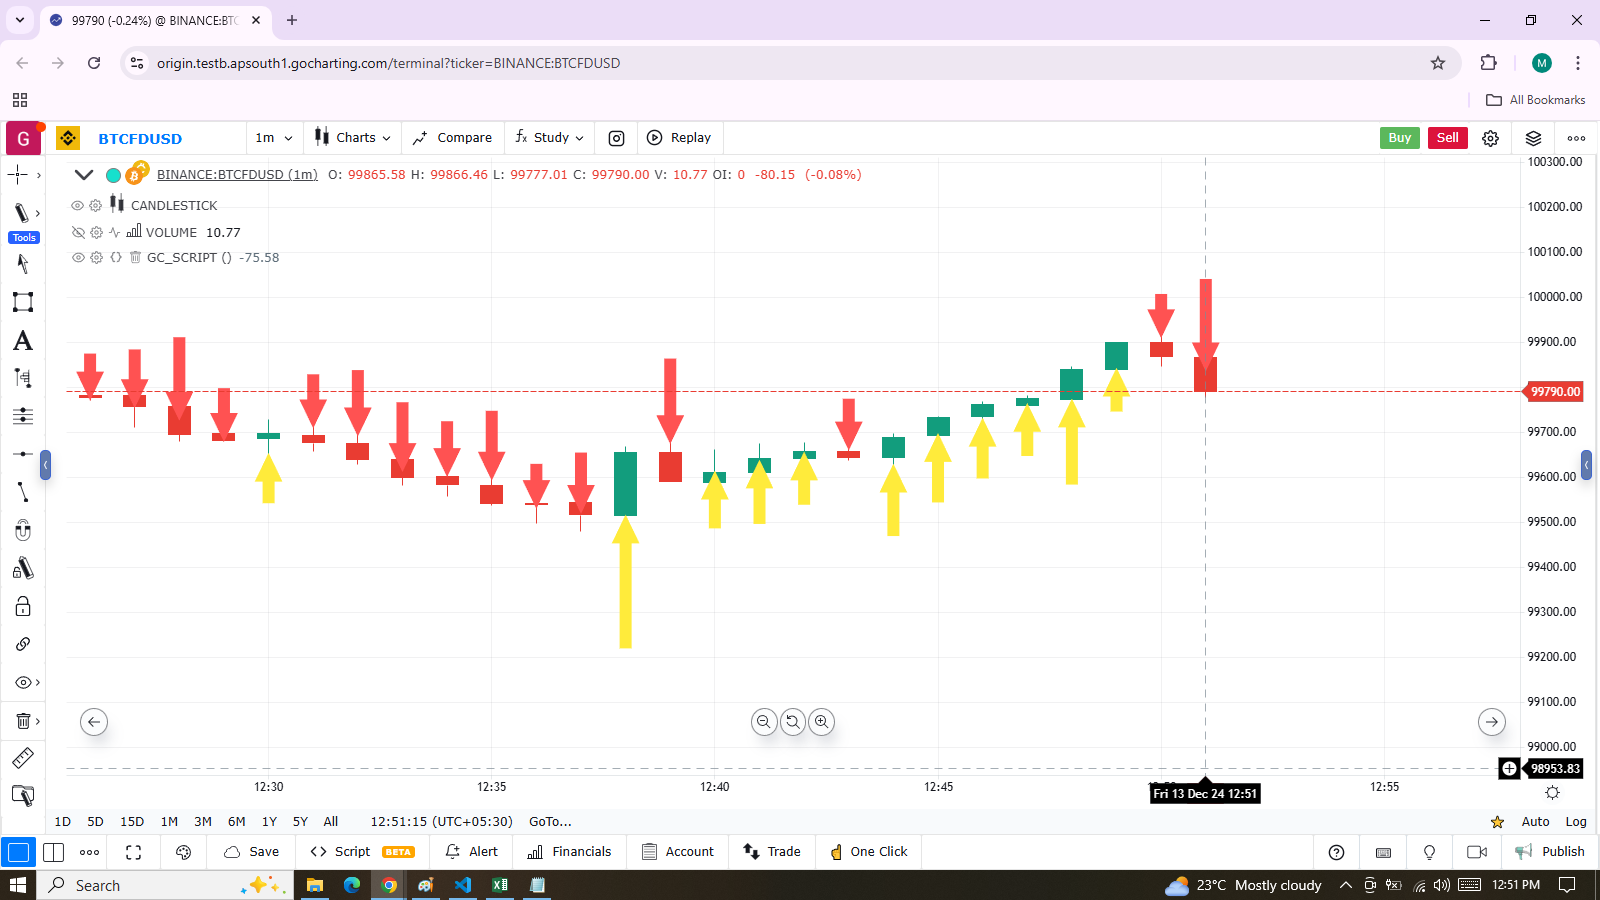
Note how the heigth of arrows is proportional to the relative size of the bar bodies.
You can use any series to plot the arrows. Here we use the value of the “Chaikin Oscillator” to control the location and size of the arrows:
indicator("Chaikin Oscillator Arrows", overlay = true)
fastLengthInput = input.int(3, minval = 1)
slowLengthInput = input.int(10, minval = 1)
osc = talib.ema(talib.tr(), fastLengthInput) - talib.ema(talib.tr(), slowLengthInput)
plotarrow(osc)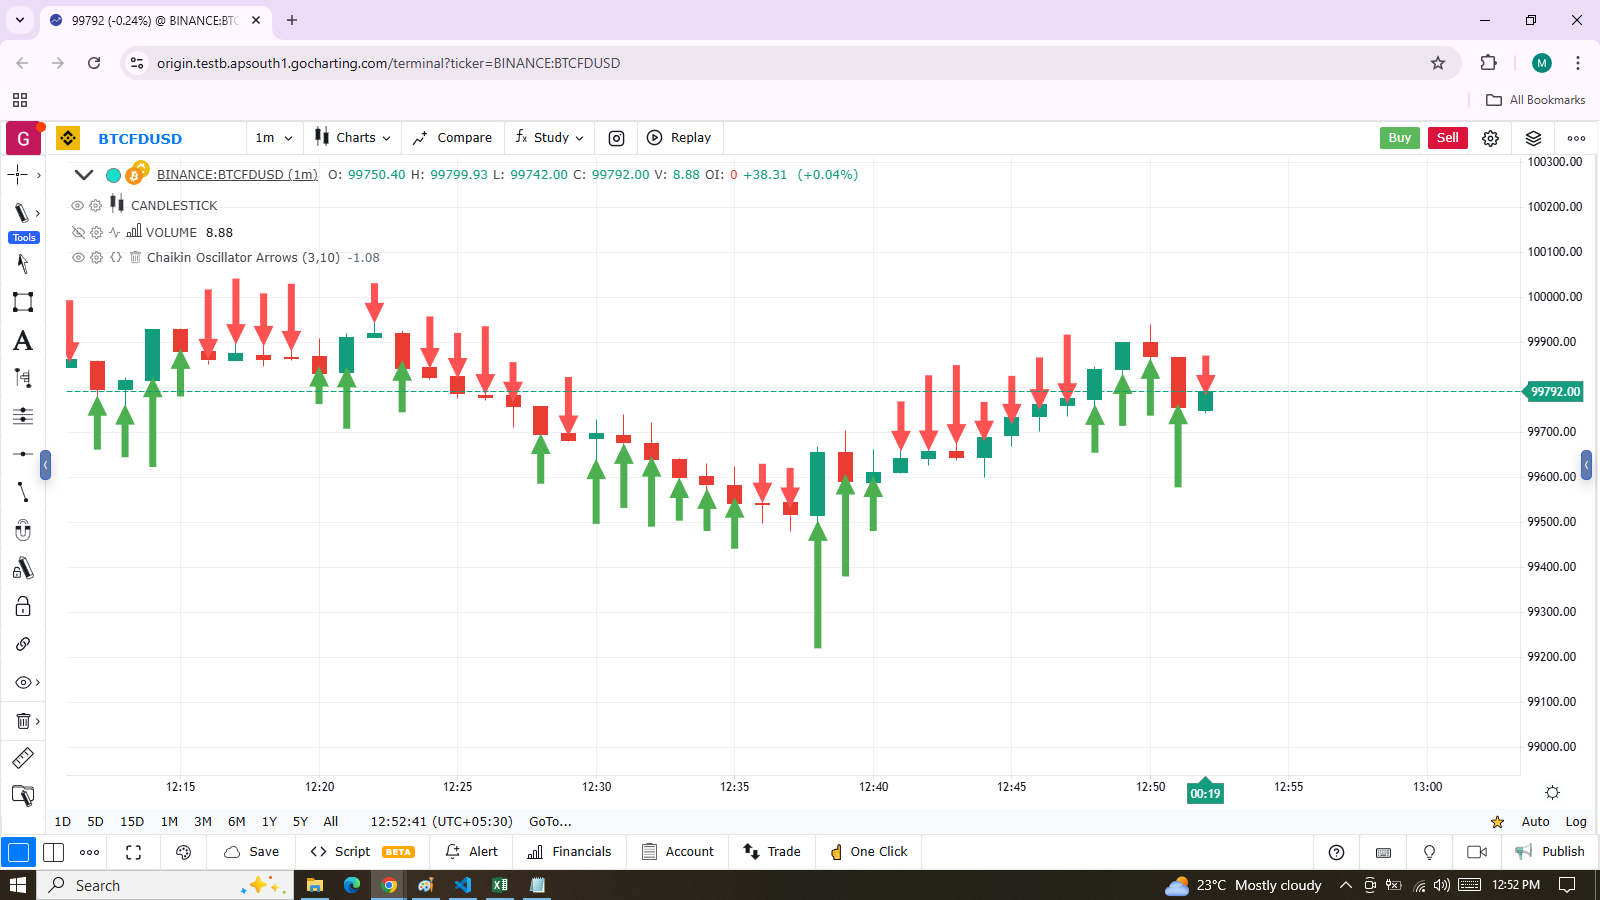
Note that we display the actual “Chaikin Oscillator” in a pane below the chart, so you can see what values are used to determine the position and size of the arrows.