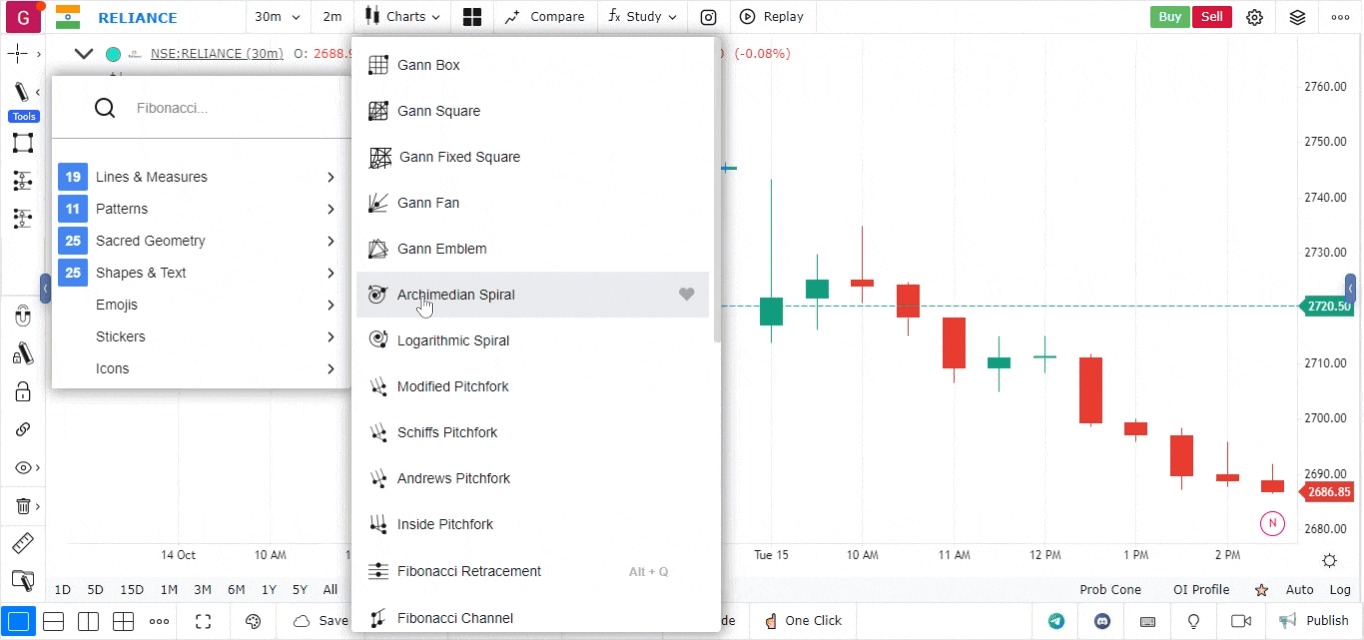
Archimedean Spiral
The Archimedean Spiral is a mathematical curve represented in technical analysis that can be utilized for various trading strategies. It can help traders visualize price movements over time and identify potential price targets or reversal points based on its unique geometric properties.
Overview of the Archimedean Spiral
The Archimedean Spiral is defined as a spiral with a constant distance between successive turns. This property makes it useful for identifying trends and cycles in price action. By integrating this spiral into a trading strategy, traders can visualize potential support and resistance levels and project future price movements based on historical data.
Key Components of the Archimedean Spiral
- Center Point: The spiral is anchored around a specific price point on the chart, typically at a significant high or low.
- Spiral Arms: The arms of the spiral represent the continuous and uniform progression of price movements, illustrating potential future price levels.
- Distance Between Turns: The consistent distance between the turns of the spiral can help traders assess the strength and momentum of price movements.
Steps to Use the Archimedean Spiral
-
Open the Platform:
- Log in to your account.
- Load the chart for the asset you wish to analyze by entering the ticker symbol.
-
Select Chart Type and Timeframe:
- Ensure your chart is set to Candlestick or another suitable type for clear visualization.
- Choose an appropriate timeframe (e.g., daily, weekly) that aligns with your trading strategy.
-
Access the Drawing Tools:
- Click on the Drawing Tools panel in the chart interface.
- Navigate to the section that includes spiral tools.
-
Locate the Archimedean Spiral Tool:
- Find the Archimedean Spiral tool within the drawing tools section.
- Select this tool to begin plotting the Archimedean Spiral on your chart.
-
Drawing the Archimedean Spiral:
- Click on the chart to define the starting point for the spiral, usually at a significant price level.
- Drag outward to create the spiral, adjusting the size and rotation as necessary to fit the price range you are analyzing.
-
Customizing the Archimedean Spiral:
- Use the settings menu to customize the appearance of the spiral, including colors and line styles.
- You can adjust the spacing between the spiral arms to align with your analysis needs.