Open Interest Sense (OI Sense)
Open Interest Sense is an indicator in GoCharting created to allow intraday traders to gauge the direction of the market in realtime mode
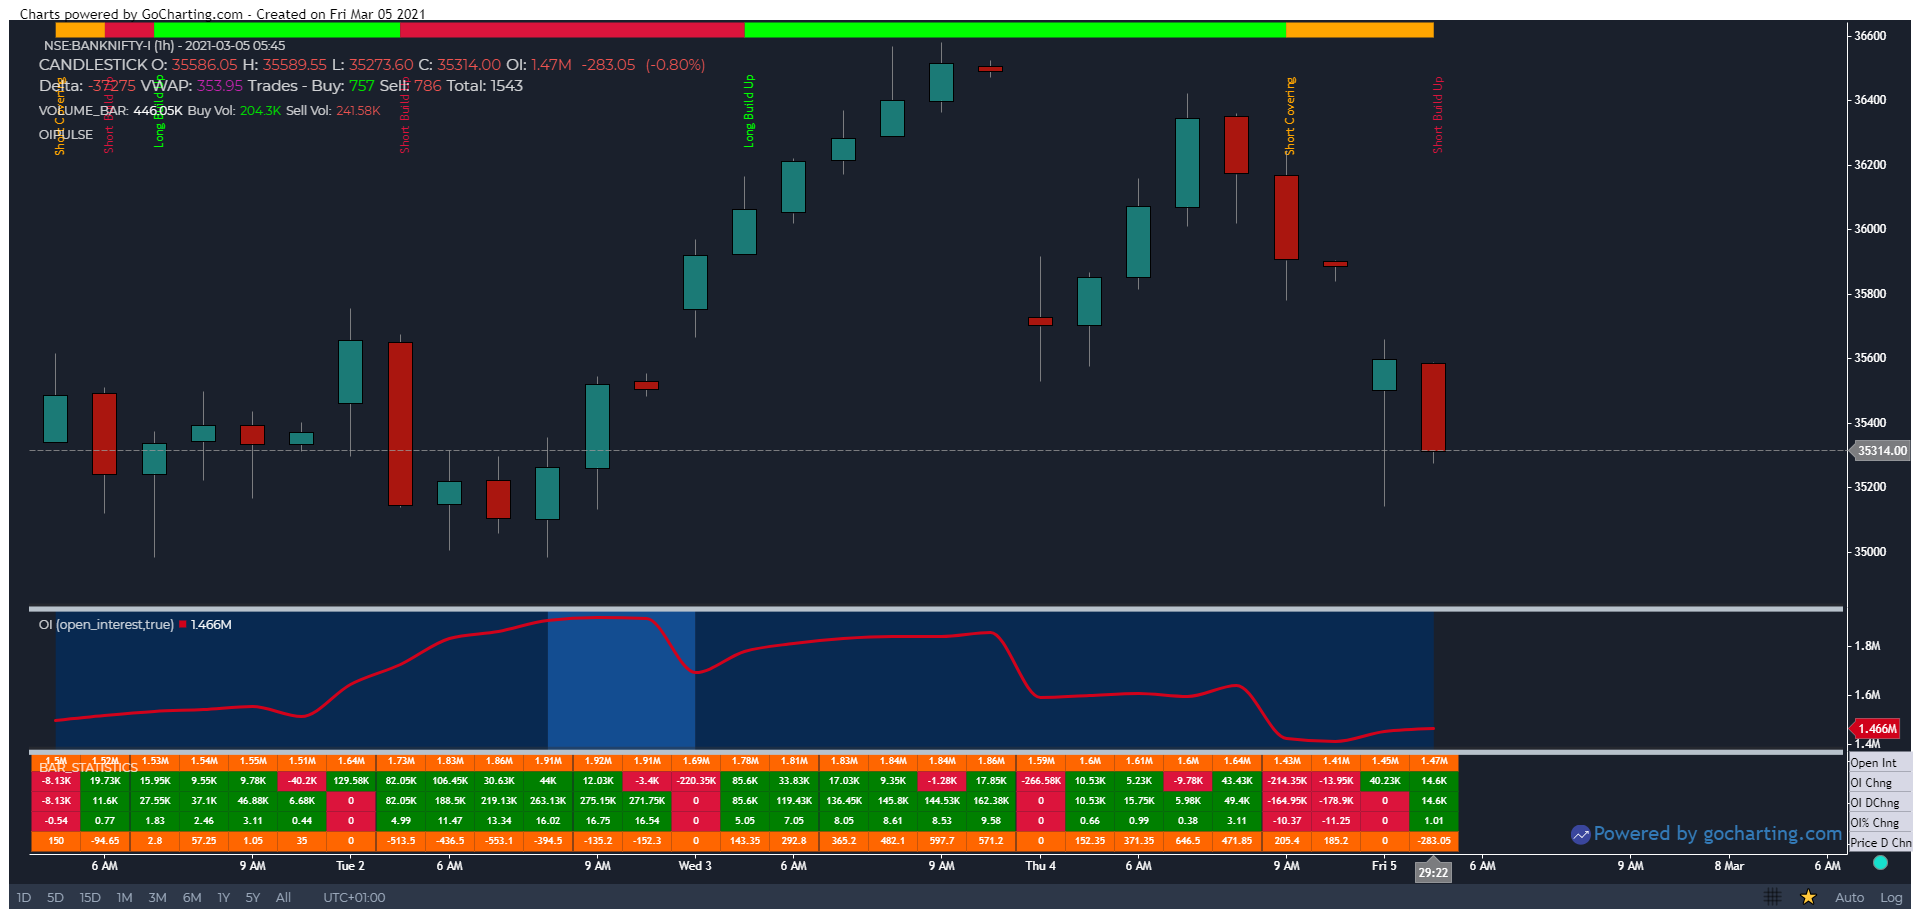
It uses a combination of price, volume and open interest data to plot a band of colors as shown below
OI Sense Color Bands
These colors bands are as follows
- Short Covering (Orange)
- Long Unwinding (Cyan)
- Short Build Up (Red)
- Long Build Up (green)
How are these Color Bands created
As shown in the chapter on Open Interest, we know the below logic holds true in the market

Open Interest Matrix
Building on this logic, we have created an extension of it which takes the Price movement % change over the course of the day along with OI % change over the course of same period to create the below rules
- Short Covering: Price change > 0 & Open Interst Change % < 0
- Long Unwinding: Price change < 0 & Open Interst Change % < 0
- Short Build Up: Price change < 0 & Open Interst Change % > 0
- Long Build Up: Price change > 0 & Open Interst Change % > 0
Below is an example of its use case. We see Gap down opening and showing early signs of Short Buildup on OI Sense

