Drawing Settings
Drawing Tools are at the core of your charting module and allow you to create shapes and geometric designs associated with your trading style viz., Gann Trading, Fibonacci Setups, Trend lines etc.
How to Add a Drawing Tool
A Drawing tool can be added from
- The left hand side panel
Main Components of a Drawing Tool
Every Drawing Tool in your chart is seen as an object on a canvas layer. Consequently, every drawing is part of your Layers Panel.
The main components on your Drawing Tool are:
- Layers Object
- Drawing Bar
- Context Menu
- Keyboard Shortcuts
Layers Objects
Every drawing object in the Layers Panel has a collapsible header showing the name and a few control buttons
Clicking on the Collapsible Header will open a drawer with detailed settings of the drawing
Drawing Bar
A drawing bar is a toolbar that appears when we add a drawing tool on the chart. It comprises of the most frequently used settings associated with the subject Drawing Tool. This Toolbar is smart enough to toggle visibility on its own depending on your actions on the chart. This toolbar is draggable and has memory coordinates built-in
To enhance UX and customization, we allow you to move the drawing bar around and place it per your convenience
Context Menu
Right click on a drawing tools will open up a Context Menu with various controls to manage your tool
The main available options are
- Apply Default: It will reset the appearance of the drawing tool to factory settings
- Edit Settings: It will open up the Drawing Tool Settings Dialogue
- Add To Favourites: Favouritize the subject tool and add it to the Top Bar Ribbon
- Object Order: It will help you move your drawing tools to the foreground or background
- Clone: It will create a clone of your existing Drawing Tool. A possible keyboard shortcut is
**CTRL + C** - Hide: Toggle the visibility of the Drawing Tool
- Delete: Remove the Drawing Tool
- Show Measure: Toggle Visibility of the Info Box that provides statistics (Price, Time, Bars, Angles) associated with every vortex of the Drawing Tool
- Edges: When enabled, the Edge Coordinates of each of the vortex of the subject Drawing Tool is always visible
- Lock Drawing: As name suggest, it will lock the drawing tool to a give position and disable drag and movement of the tool relative to the chart
How do I add and manage my favourite Drawing Tools?
The Top Bar acts as a Customized Ribbon to house all your favourite tools including the Drawing Tools
My Drawing Tool is blocking the candle view. Can I push to the background?
What is the easiest way to open the Drawing Settings Dialogue?
DOUBLE CLICK !!!
Any Shortcut to delete the Drawing Tool?
Yes, DELETE button on your keyboard
Keyboard Shortcuts: Press F1 to open the Shortcut Dialogue Panel
Manage Drawing Options
Managing drawings of a chart layout in GoCharting is an important feature for traders who use various technical analysis tools like trendlines, Fibonacci retracements, or support/resistance levels.
After selecting a layout using the Save button at the bottom, you can create drawings on multiple stocks—whether by selecting them from your watchlist or searching for them directly. Using the Manage Drawings option, you can view all the drawings you’ve made on different stocks within a particular layout, making it easy to track your technical analysis across various assets.
The Manage Drawing option is located at the bottom of the drawing toolbar. Once you press the button, you will be able to see the drawings of that layout across various stocks and synced layouts.
Group Drawing Option
In GoCharting, grouping drawings is a useful feature that allows traders to manage multiple drawings (like trendlines, Fibonacci retracements, or shapes) more efficiently. By grouping drawings, you can move, edit, or hide them collectively, which is particularly helpful when working with multiple drawings on charts.
To group drawings, you can follow these steps:
- Open layers on the widget bar.
- Hover your mouse over any drawing and click on Create Group. After creating the group, you can give it a name.
- You can drag different drawings under this group.
- You can also create drawing groups by right-clicking on a drawing and selecting the Grouping option.
Drawing Settings: Draw Mode
In GoCharting, Draw Mode allows traders to continuously draw multiple annotations without needing to repeatedly select the same drawing tool. This feature streamlines the process, especially when adding multiple lines, shapes, or annotations for technical analysis, saving time and effort.
Draw mode can be accessed from the toolbar by clicking on Draw Mode.
Hide/Unhide Feature
In GoCharting, the Hide/Unhide feature allows traders to temporarily hide or reveal all drawings, indicators, or objects on a chart without deleting them. This is useful when you want to focus on price action or other indicators without the clutter of annotations.
This feature can be accessed from the toolbar.
Magnet Tool
The Magnet tool in GoCharting helps with precision when placing trendlines, support and resistance lines, or other technical analysis elements. When activated, the magnet tool automatically “snaps” to the nearest price point (usually the open, high, low, or close of a candle) instead of allowing the user to place lines arbitrarily.
To activate it, press the Magnet Mode on the toolbar.
Measure Tool
The Measure Tool in GoCharting is used to calculate parameters like price difference, percentage change, and distance between two points on a chart. This tool can be accessed from the toolbar by clicking the Measure Tool button.
The following parameters can be accessed through this tool:
- Number of bars.
- Volume.
- Change in open interest.
- Cumulative volume delta.
- Change in price (in absolute and percent).
Brush Tool
The Brush Tool in GoCharting is a freehand drawing tool that allows traders to annotate charts with custom shapes, lines, or highlights. It’s useful for visually marking areas of interest, emphasizing certain patterns, or adding personal notes directly onto the chart. The brush tool provides flexibility for freeform drawings beyond standard shapes like trendlines or rectangles.
Highlighter Tool
The Highlighter Tool in GoCharting is designed to help traders visually emphasize certain areas or patterns on their charts. It functions like a marker, allowing you to highlight specific price zones, candlestick patterns, or key levels, making it easier to track and refer to important areas of interest during analysis.
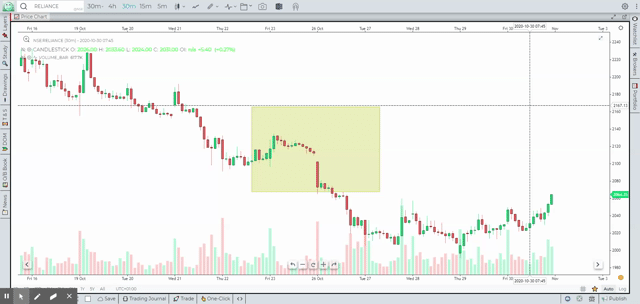
Drawing Fixed Range Market Profile
Ranging markets are of significant interest to traders, as they are often the origin points of breakout or breakdown trades. Identifying the value area of a consolidation range can provide insight into potential market moves. To accomplish this, you can use the Fixed Range Market Profile feature, which allows traders to plot market profiles over a selected range.
Steps to Draw Fixed Range Market Profile:
- Access the Tool:
- Navigate to the Drawing Tool menu.
- Go to Shapes and Texts.
- Select Fixed Range Market Profile.
- Select the Range:
- First, click on the origin candle of the consolidation range.
- Then, select the last candle of the consolidation range.
This will plot the market profile for the entire range, highlighting key areas like the Point of Control (POC) and value area.
- Compatibility:
- The Fixed Range Market Profile can be plotted on all scripts, including those that do not have volume data (e.g., index charts).
- However, Fixed Range Volume Profiles will not plot on indexes, as they do not contain volume data.
Drawing Fixed Range Volume Profile
Similar to the Fixed Range Market Profile, traders can use the Fixed Range Volume Profile to analyze the volume distribution within a selected consolidation range. This helps identify the value area where the majority of the trading volume occurred, aiding in breakout or breakdown trade analysis.
Fixed Range Volume Profile (Tick Version)
The Fixed Range Volume Profile (Tick Version) is an upgraded version of the standard volume profile. Unlike the traditional version, which uses bins to represent data, the tick version presents the data in the form of ticks for more precise analysis.