Indicator Settings
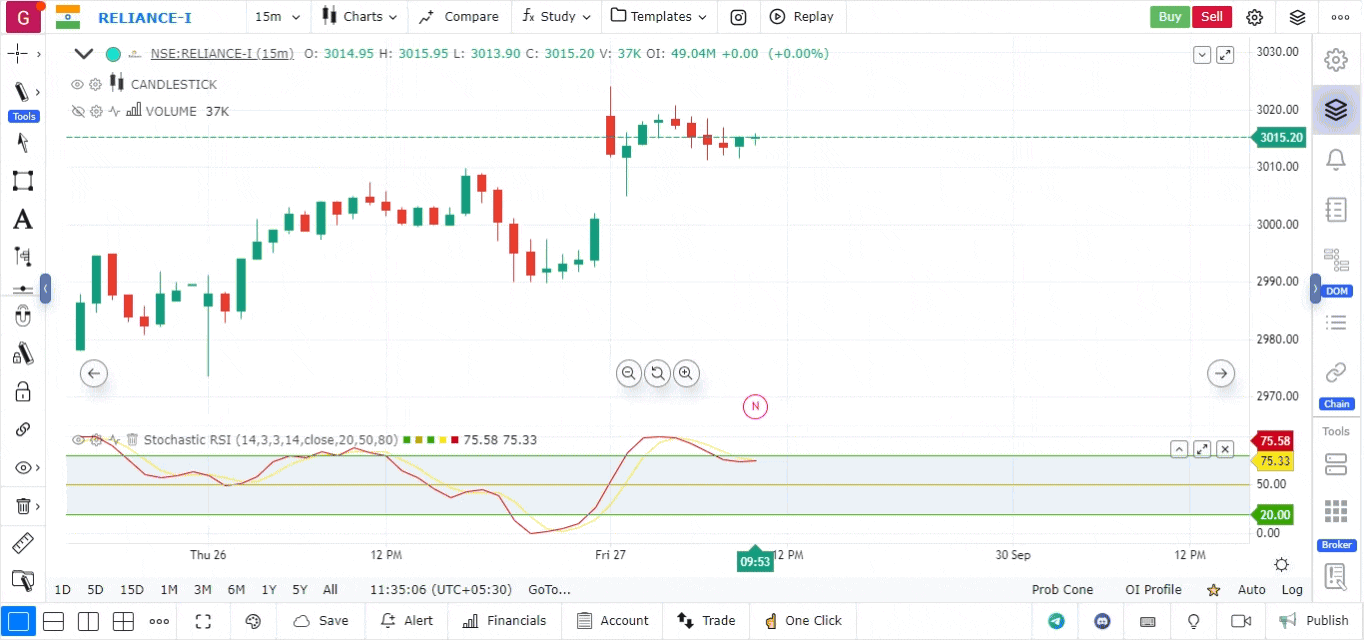
Indicators or Studies are statistical analyses on price, time and volume with an effort to either explain current turn of events in the market or predict/forecast future prices
How to Add an Indicator
An Indicator can be added from
- The top bar indicator menu OR
- The left hand side panel
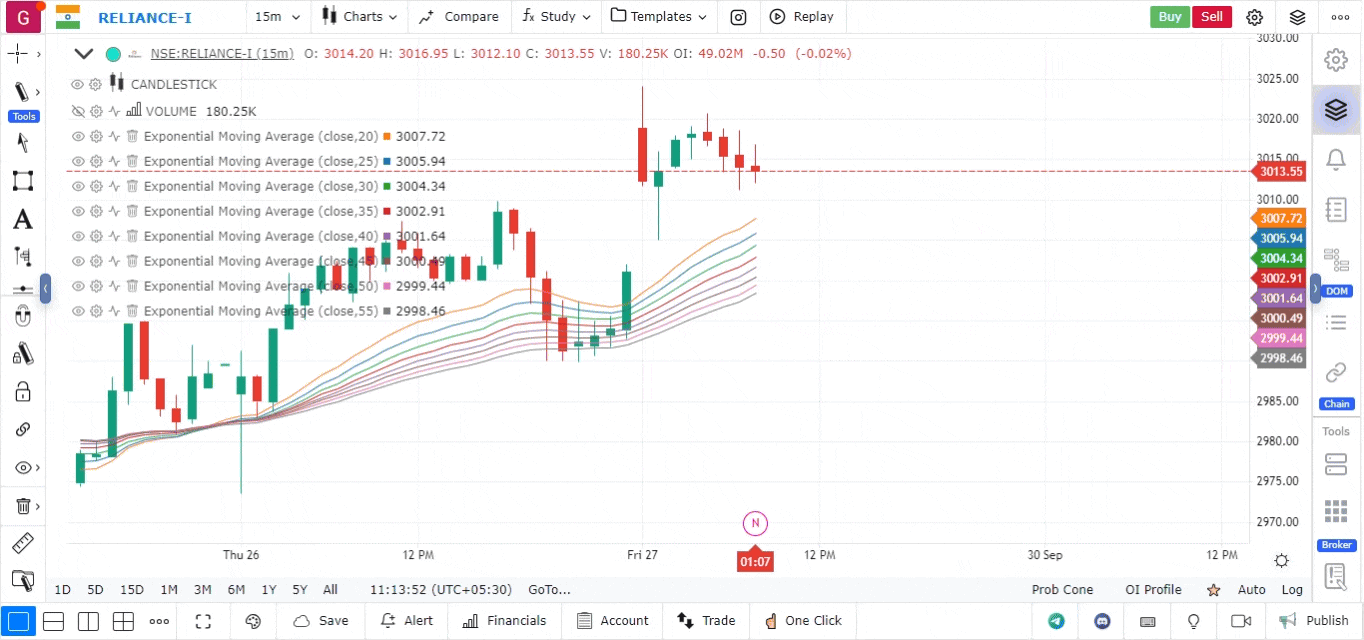
Main Components of the Indicator
Every Indicator in your chart is seen as an object on a canvas layer. Consequently, every indicator/study is part of your Layers Panel.
The main components of an Indicator are:
- Layers Panel
- Tooltip Icons & Legend/Tooltip
- Edge Coordinates
Layers Objects
Every indicator in the Layers Panel has a collapsible header showing the name and a few control buttons. Clicking on the Collapsible Header will open a drawer with detailed settings of the indicator.
Few common functions on all Objects in the Layers Panel
- Customize the Indicator Labels
- Toggle the Edge Coordinators
- Change the appearance of the series
- Reset Defaults
Lets see them in action
Tooltip/Legend
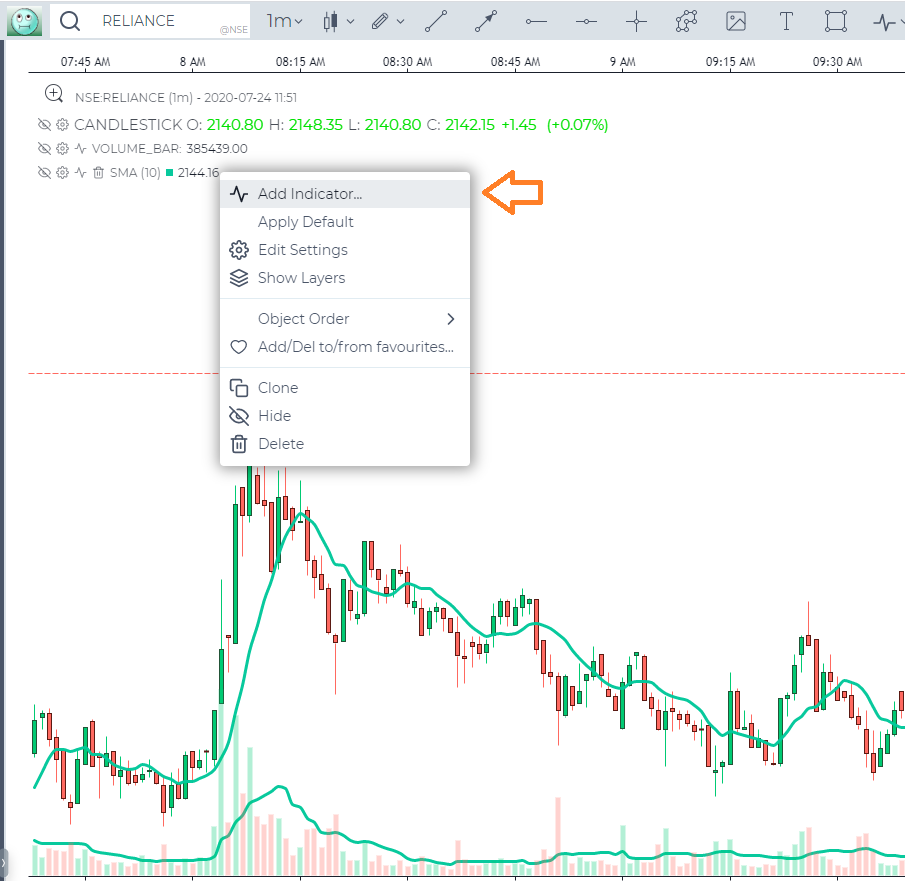
Right or simple click on a indicator tooltip/legend will open up a Context Menu with various controls to manage yoFur tool
- Add Indicator: Add an Indicator on an existing Indicator. This is an extremely rare feature and allows up to develop complex strategies based on indicators built on top of the existing indicators. Such as a EMA on RSI.
- Apply Default: It will reset the appearance of the indicator to factory settings
- Edit Settings: It will open up the Indicator Settings Dialogue
- Object Order: It will help you move your indicators to the foreground or background
- Add To Favourites: Favouritize the subject tool and add it to the Indicators Favourite section (Indicators Menu on the Top Bar Ribbon)
- Clone: It will create a clone of your existing Indicator.
- Hide: Toggle the visibility of the Indicator.
- Delete: Remove the Indicator
What is the easiest way to change the Indicator Settings (single click please)?
Clicking on the Tooltip “Settings” icon will open up the Indicator Settings Dialogue. The panel is draggable and it has a memory coordinates built-in – meaning you can place it per your convenience on the browser
How do I Add Indicator on Indicator
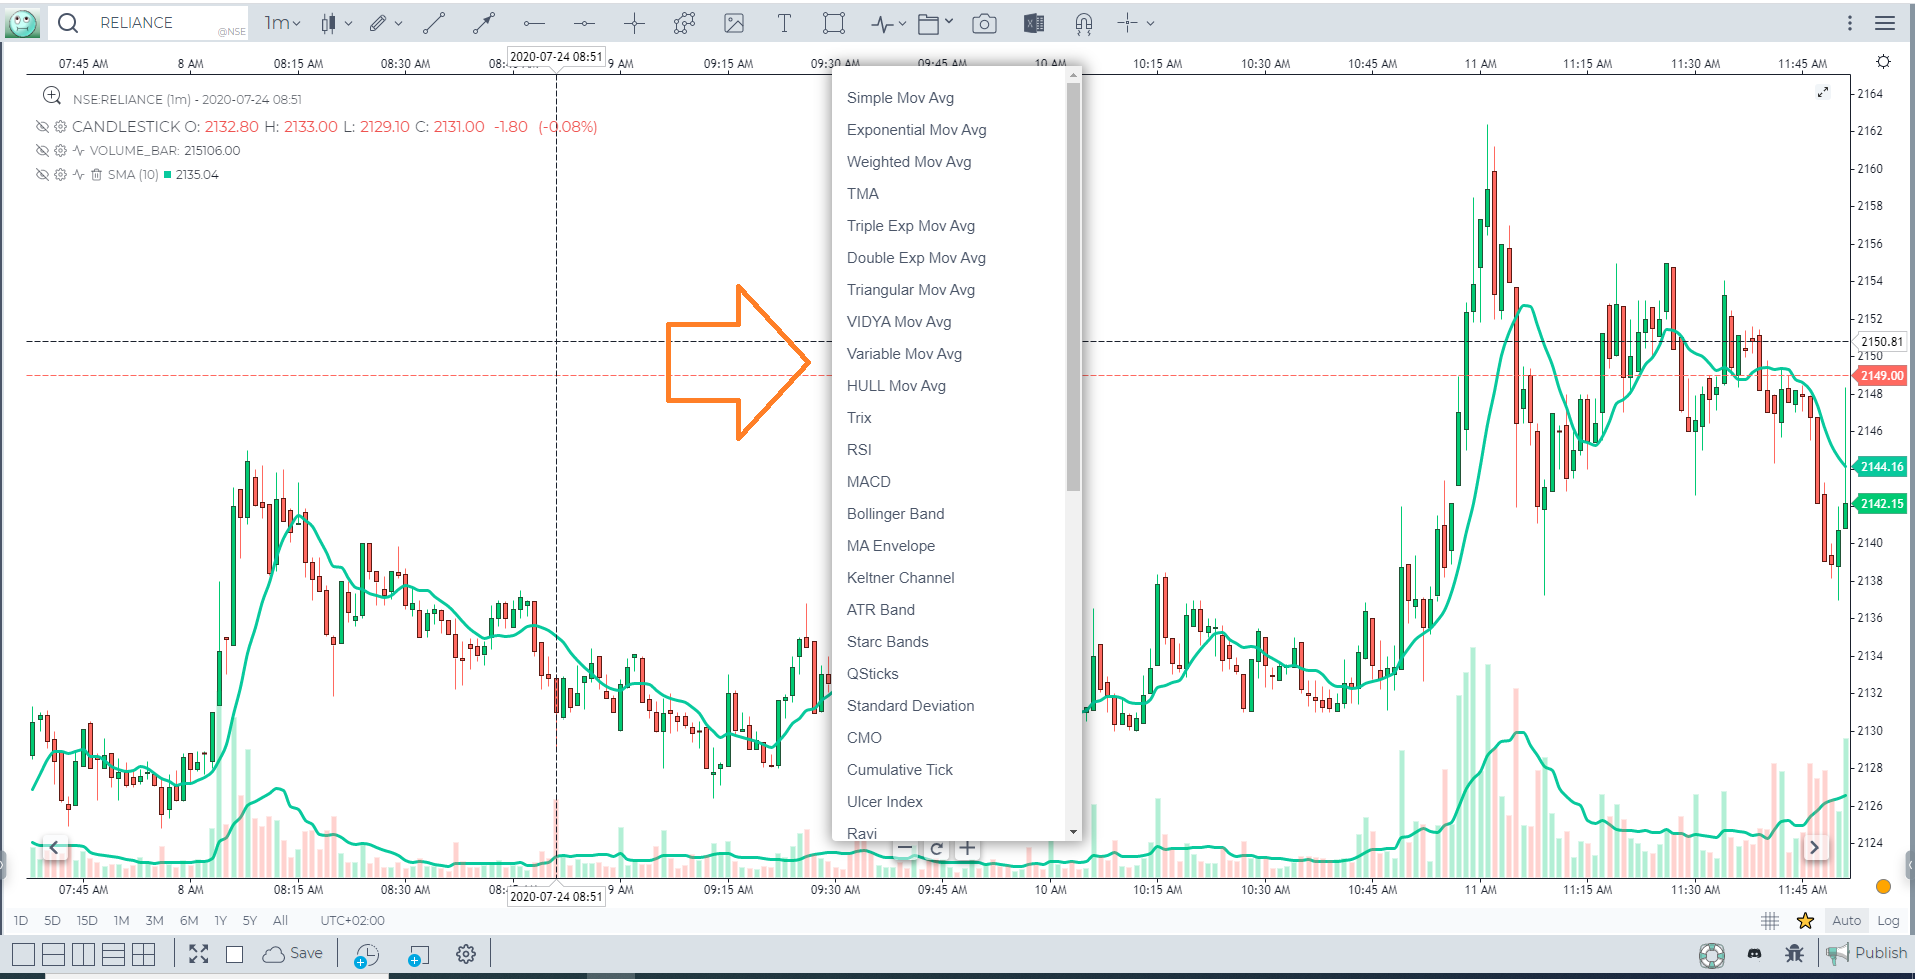
Click on the Indicator series legend and select “Add Indicator” option
A new Indicator selection menu will appear to choose from
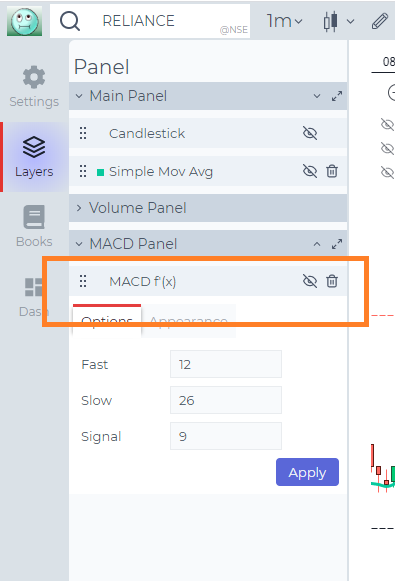
All Indicators which derive its value from another indicator will have their underlying series mentioned in their own series legend.
Below is an example of a MACD built on a Simple Moving Average
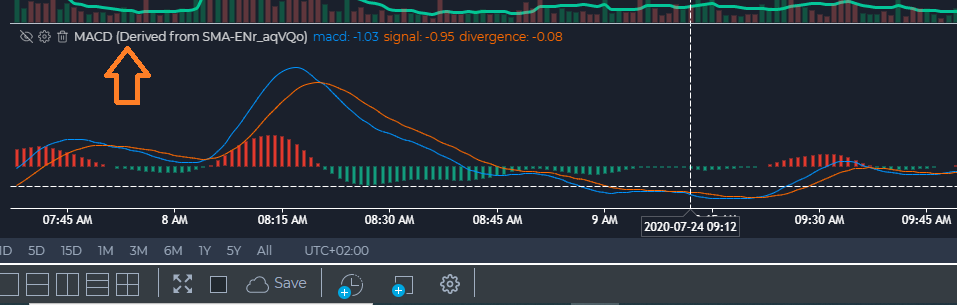
Finally, these indicators will come with a derivative symbol [f′(x)] on the Layers Tab
How do I manage my favourite indicators?
The heart Icon next to every indicator in the Indicator Menu is used to favouritize the indicator
How do I manage my favourite combination of indicators?
You manage your favourite combination of indicators using the Template feature
How do I push my Market and Volume Profile behind the candles?
Object Order decides the visisbility order
How do I manage all the Edge Coordinates?
All Edge Coordinates are managed through the Price Axes Context Menu
Template
Creating a template for indicators allows you to save your preferred set of indicators for future use. This is especially useful for traders who rely on a specific combination of technical indicators and want to apply them quickly across multiple charts without setting them up each time.
Steps to Create and Use a Template for Indicators
-
Set Up Your Indicators:
- Load the chart of your desired asset.
- Add the technical indicators you typically use. For example:
- Moving Averages (SMA, EMA) for trend analysis.
- Bollinger Bands for volatility.
- RSI or MACD for momentum and divergence.
- Customize the settings for each indicator (e.g., adjusting periods, colors, and line styles) to match your trading strategy.
-
Save as Template:
- Once your chart is configured with the desired indicators and settings, go to the top right of the interface.
- Click on the Templates option (represented by an icon that looks like a gear or set of squares).
- Select “Save Template” from the dropdown menu.
- Give your template a name (e.g., “Swing Trading Setup” or “Scalping Indicators”).
- Click “Save” to store your template.
- Applying a Saved Template:
- To quickly load the same set of indicators on a different chart, open the new chart.
- Click on the Templates icon again.
- Select the saved template from the list, and all your predefined indicators and settings will be applied instantly.
Indicator on Indicator
In the platform, the “Indicator on Indicator” feature allows you to apply one indicator on top of another, creating a layered analysis. This is useful for traders who want to gain deeper insights by combining indicators in a more advanced way. For example, applying a moving average (MA) to the Relative Strength Index (RSI) or using Bollinger Bands on an oscillator can help in refining signals.
How to Apply an Indicator on Another Indicator:
-
Add the Base Indicator:
- Open your chart and select the asset you want to analyze.
- Add the base indicator (e.g., RSI, MACD, or Stochastic).
- Go to the top toolbar, click on “Indicators,” and choose your desired indicator.
-
Add the Second Indicator (On Top of the First Indicator):
- Go back to the “Indicators” section, search for the second indicator (e.g., Moving Average for smoothing).
- Select the base indicator as the data source (e.g., RSI for the moving average).
- The second indicator will now be calculated based on the values of the first.
Grouping Indicators
In the platform, you can group multiple indicators into a single group for better chart management. This helps reduce visual clutter and provides an easy way to manage indicators collectively.
Steps to Group Indicators:
-
Open the Layers Panel:
- Click on the “Layers” icon in the widget bar to view all the indicators and chart elements in use.
-
Create a Group:
- Hover your mouse over any indicator and click on “Create Group.”
- Give the group a name for easier identification.
-
Drag Indicators into the Group:
- Drag other indicators into the newly created group in the layers panel.
- Create Groups via Right-Click:
- Right-click on any indicator and choose “Grouping” from the menu to create or add to a group.
Shift Indicator Panes and Pin Their Scales
On the chart, there are multiple panes. When we add a new indicator, it will either appear in the main panel or be created in a new pane below. The pane information can be checked from the layers option. Sometimes we need to group two indicators in the same pane to easily compare them. To do this, we need to shift the panes of indicators.
Steps to Shift Indicator Panes and Pin Scales:
- How to See Pane Buttons:
- To make the pane buttons visible, go to the settings in the top right corner and navigate to the Legend setting.
- You will have the option to show or hide pane and navigation buttons.
- Using Pane Buttons:
- You can use these pane buttons to shift panes up or down, enlarge, or close them.
-
Move Indicators Between Panes:
- Right-click on the indicator in a pane, and you will get the option to Move To.
- From there, you can move the indicators to existing panes above or below.
-
Pin Scales After Merging Panes:
- If you have merged two panes into one, right-click on any indicator.
- You will get the option to Pin Scale to lock its scale for better comparison.
Presets in Indicators
In the paltform, you can customize the settings for each indicator and save those settings as a preset for future use. This allows you to quickly switch between different indicator settings without manually adjusting them each time.
How to Create and Use Presets:
-
Create a Preset:
- Right-click on the indicator, click on “Preset,” and then select “Save As.”
-
Apply a Preset:
- Right-click on the indicator again and choose your saved preset from the list.