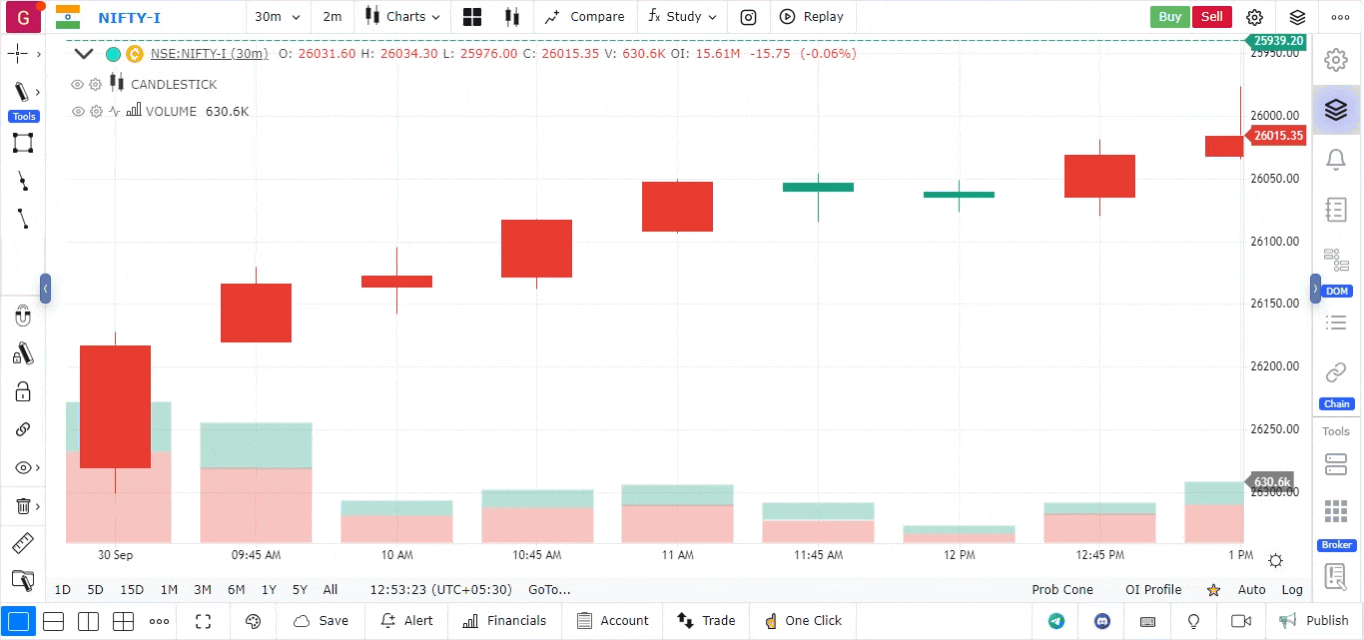
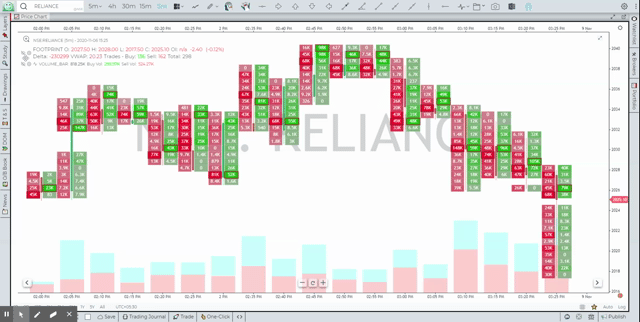
Cluster aka Footprint Chart
Cluster or Footprint chart is a professional analytical tool that shows OHLC prices and trading volume on a single chart.
Footprint chart is a type of candlestick chart, however it provides additional information such as bid/ask/total volume at every price, in addition to the open, high, low and close seen on a basic candlestick chart. Footprint charts are special as they are multi-dimensional in nature and allow traders to observe additional market variables overlaid on a candlestick chart like volume, bid-ask spreads, and liquidity levels. Traders have the ability to customize footprint charts to include those individual variables that is most suited to them and which would eventually help them gauge the sentiment. The variations that can be configured for a footprint chart would be discussed in the later part of the section.
Using this information, a trader can evaluate:
- trading volume, which executed for each price
- zones of maximum volume accumulation
- zones of high trading interest (the maximum number of trades)
- the number of buyers and sellers at each price level
How to add Cluster aka Footprint chart
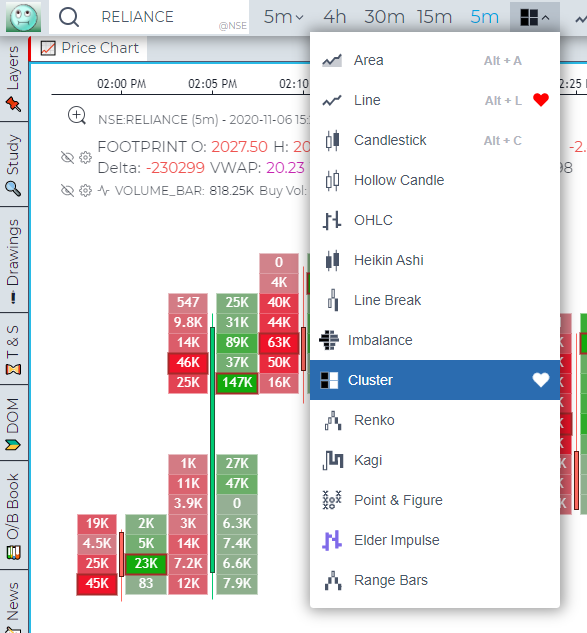
To activate the Cluster chart, simply choose the chart type from the dropdown
Cluster Chart Settings
Click on the gear icon on the Chart Legend/Tooltip to open the Settings Dialgue for Cluster Charts
Cluster chart has various settings allowing to display volume data from different sides. For example, you can choose different types of data for each bar, as well as configure colors, which will simplify the perception and analysis of volumes, trades, etc.
The main Data Types for cluster chart:
- Trades — it’s the number of contracts (trades) that executed at each price level.
- Buy (or Sell) trades — it’s the number of Buy (or Sell) trades that executed at each price level.
- Volume — the total size of all positions that executed at each price level or price range.
- Buy (or Sell) Volume — the total size of all Buy (or sell) positions that executed at each price level or price range.
- Buy (or Sell) Volume, % — shows how many percent of the total volume relates to Buy (or Sell) trades
- Delta and Delta % — shows the difference in traded Volume between Buyers and Sellers. It allows evaluating who controls the price on the market at a given time. Delta % = Prominent Side Volume (Buy or Sell) / Volume * 100
We recommend the below eBook for deep dive into Footprint charts straight from the original creators of Footprint charts
Download MarketDelta Strategy Guide
Preset Options for Cluster Chart
GoCharting provides a variety of preset options for cluster charts, making it easier for traders to analyze market data without the need for extensive manual customization. Here’s how to access and utilize these presets:
Accessing Preset Cluster Charts
-
Apply Cluster Charts:
- First, select Cluster Charts from the chart types available.
-
Right-click on the Cluster Chart:
- Position your cursor over the cluster chart and right-click to access the context menu.
-
View Preset Options:
- A list of preset options will appear.
- A list of preset options will appear.
Available Preset Options
Here are the various presets you can choose from:
- Delta Profile: Displays the difference between buying and selling volume, providing insight into market sentiment.
- Bid Ask Profile: Shows the distribution of bid and ask prices, helping traders understand market depth.
- Volume Profile: Visualizes the volume traded at different price levels, offering a comprehensive view of trading activity.
- Focus Footprint: A detailed view emphasizing specific price levels and volume, aiding in identifying key market areas.
- Lopsided Footprint: Highlights imbalances in buying and selling, useful for spotting potential reversals.
- Classic: A traditional footprint chart layout, presenting essential trading information in a familiar format.