Fills
Introduction
Some of Lipi Script’s visual outputs, such as plots, horizontal lines (hlines), lines, boxes, and polylines, provide the ability to fill the chart space they occupy with colors. There are three distinct mechanisms for filling the space between these outputs:
- The
fill()function fills the area between two plots created withplot()calls or two horizontal lines created withhline()calls, using a specified color. - Objects of the
linefilltype fill the area between line instances created usingline.new(). - Other drawing types, such as boxes and polylines, have built-in properties that automatically fill the visual spaces they occupy.
plot() and hline() Fills
The fill() function is used to fill the space between two plots or horizontal lines. It has the following two signatures:
fill(plot1, plot2, color, title, editable, show_last, fillgaps) → void
fill(hline1, hline2, color, title, editable, fillgaps) → void
The plot1, plot2, hline1, and hline2 parameters accept plot or hline IDs returned by plot() and hline() function calls. The fill() function is the only built-in function that can utilize these IDs.
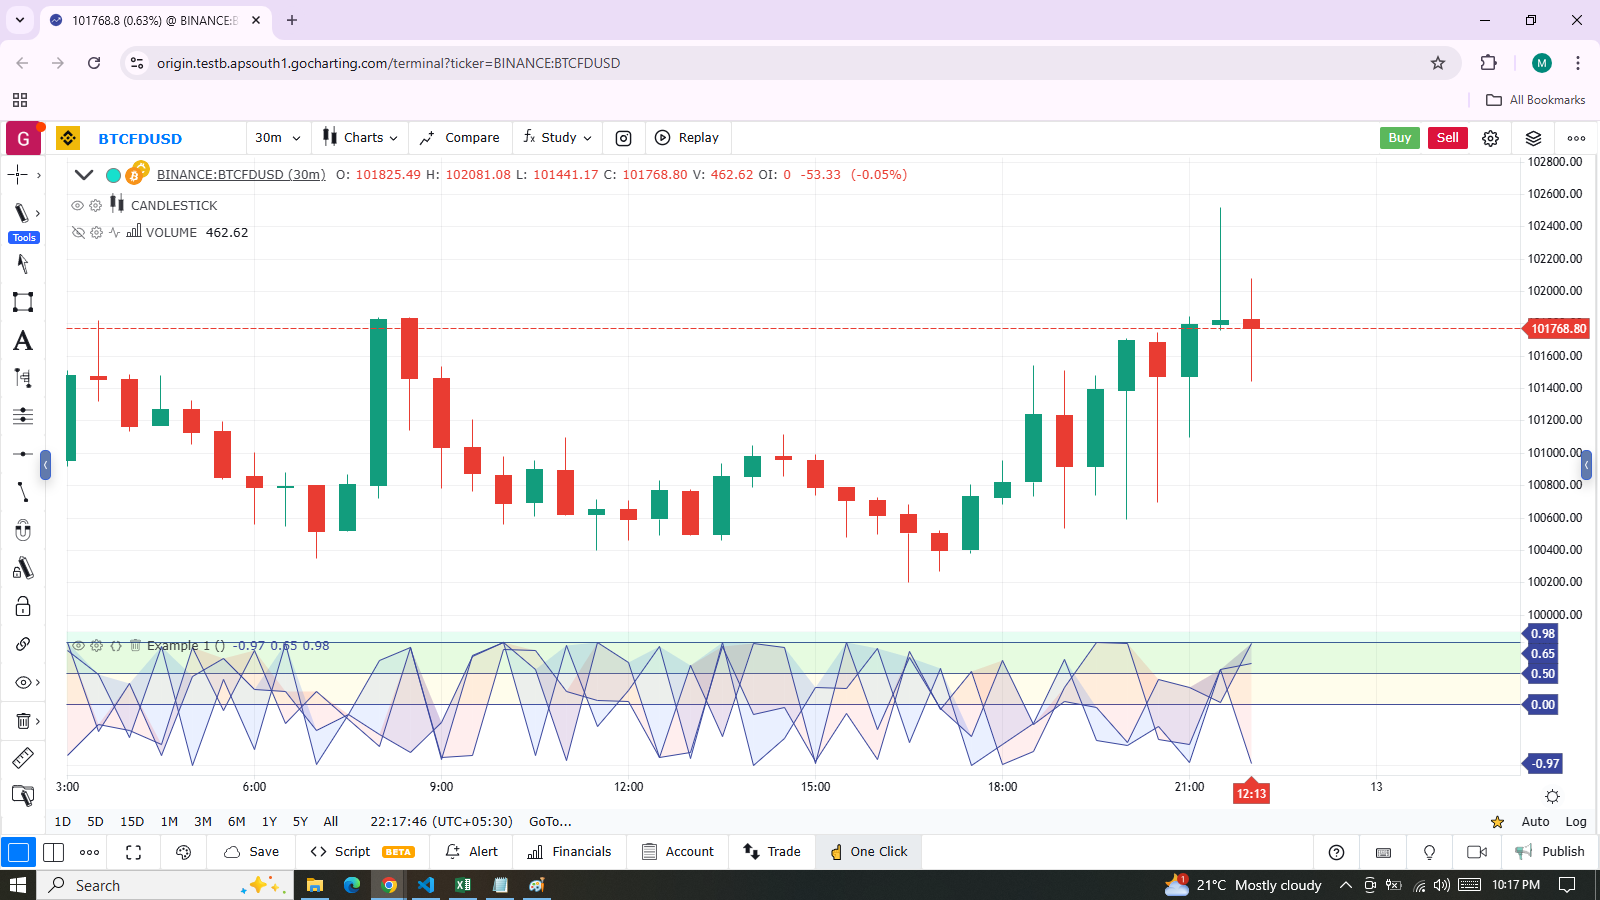
This simple example demonstrates how the fill() function works with plot and hline IDs. It calls plot() and hline() three times to display arbitrary values on the chart. Each of these calls returns an ID, which the script assigns to variables for use in the fill() function. The values of p1, p2, and p3 are plot IDs, while h1, h2, and h3 reference hline IDs:

indicator("Example 1")

// Assign "plot" IDs to the `p1`, `p2`, and `p3` variables.
p1 = plot(math.sin(high), "Sine of `high`")
p2 = plot(math.cos(low), "Cosine of `low`")
p3 = plot(math.sin(close), "Sine of `close`")
// Fill the space between `p1` and `p2` with 90% transparent red.
fill(p1, p3, color = color.new(color.red, 0.1), title = "p1-p3 fill")
// Fill the space between `p2` and `p3` with 90% transparent blue.
fill(p2, p3, color = color.new(color.blue, 0.1), title = "p2-p3 fill")

// Assign "hline" IDs to the `h1`, `h2`, and `h3` variables.
h1 = hline(0, "First level")
h2 = hline(1.0, "Second level")
h3 = hline(0.5, "Third level")
h4 = hline(1.5, "Fourth level")
// Fill the space between `h1` and `h2` with 90% transparent yellow.
fill(h1, h2, color = color.new(color.yellow,0.1), title = "h1-h2 fill")
// Fill the space between `h3` and `h4` with 90% transparent lime.
fill(h3, h4, color = color.new(color.lime, 0.1), title = "h3-h4 fill")
It’s important to note that the fill() function requires either two plot IDs or two hline IDs. Mixing and matching these types in a single function call is not allowed. As a result, programmers may sometimes need to use plot() where they might have used hline() if they want to fill the space between a consistent level and a fluctuating series.
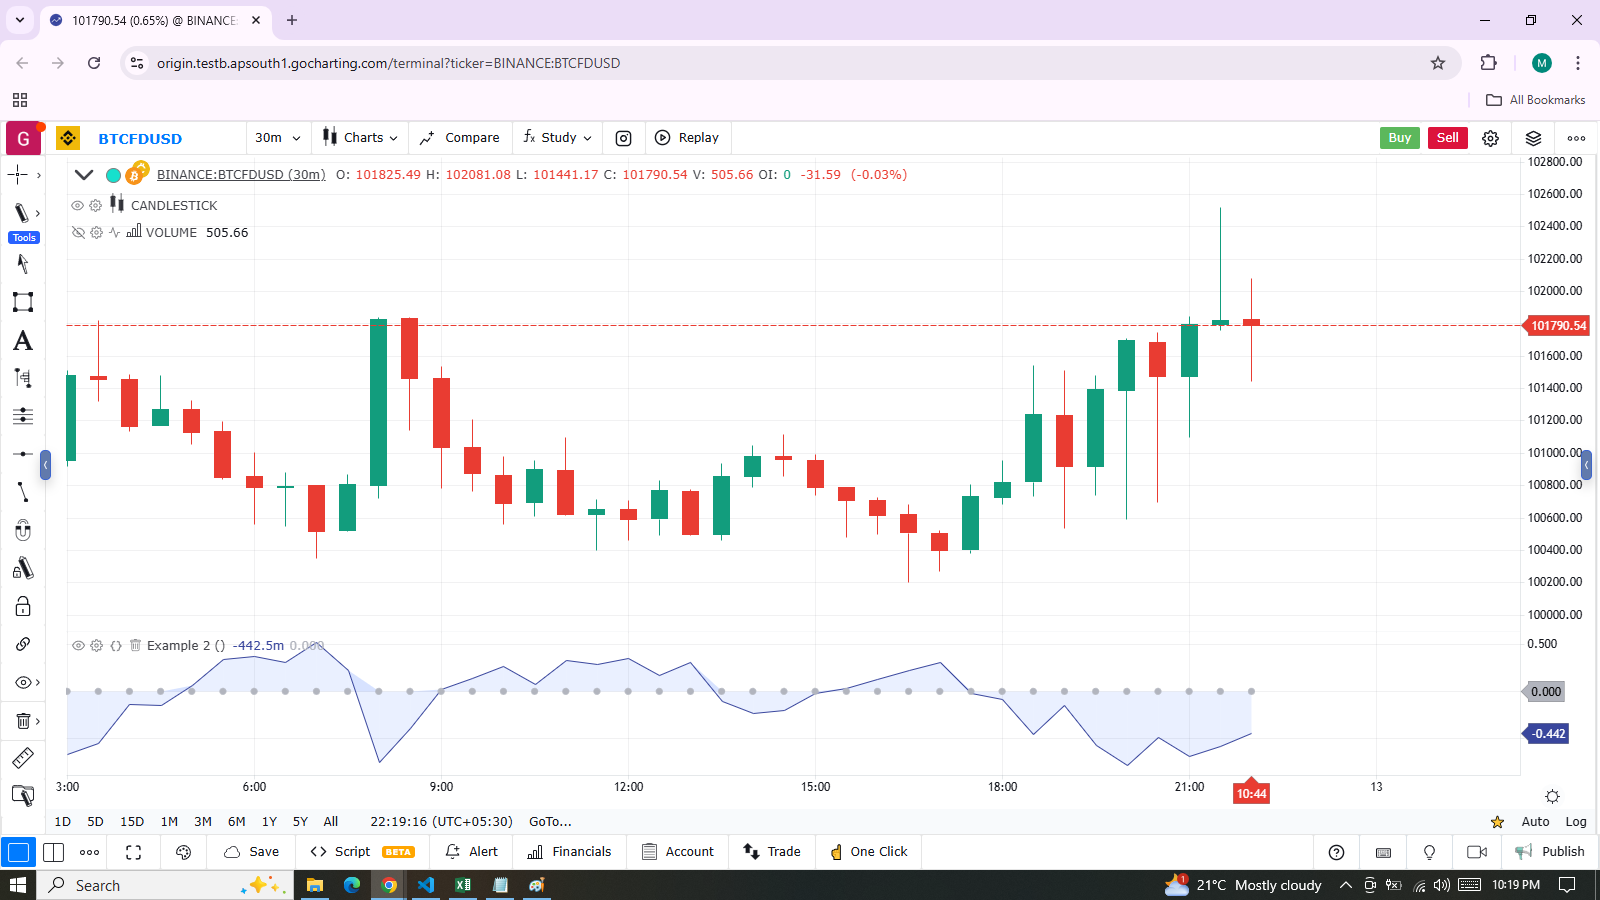
For example, this script calculates an oscillator based on the percentage distance between the chart’s close price and a 10-bar SMA, then plots it on the chart pane. In this case, we wanted to fill the area between the oscillator and zero. While we can display the zero level with hline() since its value is constant, we cannot pass a plot and an hline ID to the fill() function. Therefore, we must use a plot() call for the level to enable the script to fill the space:

indicator("Example 2")

//@variable The 10-bar moving average of `close` prices.
float ma = talib.sma(close, 10)
//@variable The distance from the `ma` to the `close` price, as a percentage of the `ma`.
float oscillator = 100 * (ma - close) / ma

//@variable The ID of the `oscillator` plot for use in the `fill()` function.
oscPlotID = plot(oscillator, "Oscillator")
//@variable The ID of the zero level plot for use in the `fill()` function.
//Requires a "plot" ID since the `fill()` function can't use "plot" and "hline" IDs at the same time.
zeroPlotID = plot(0, "Zero level", color.silver, 1, style = plotStyle.scatter)

// Filll the space between the `oscPlotID` and `zeroPlotID` with 90% transparent blue.
fill(oscPlotID, zeroPlotID, color = color.new(color.blue, 0.1), title = "Oscillator fill")
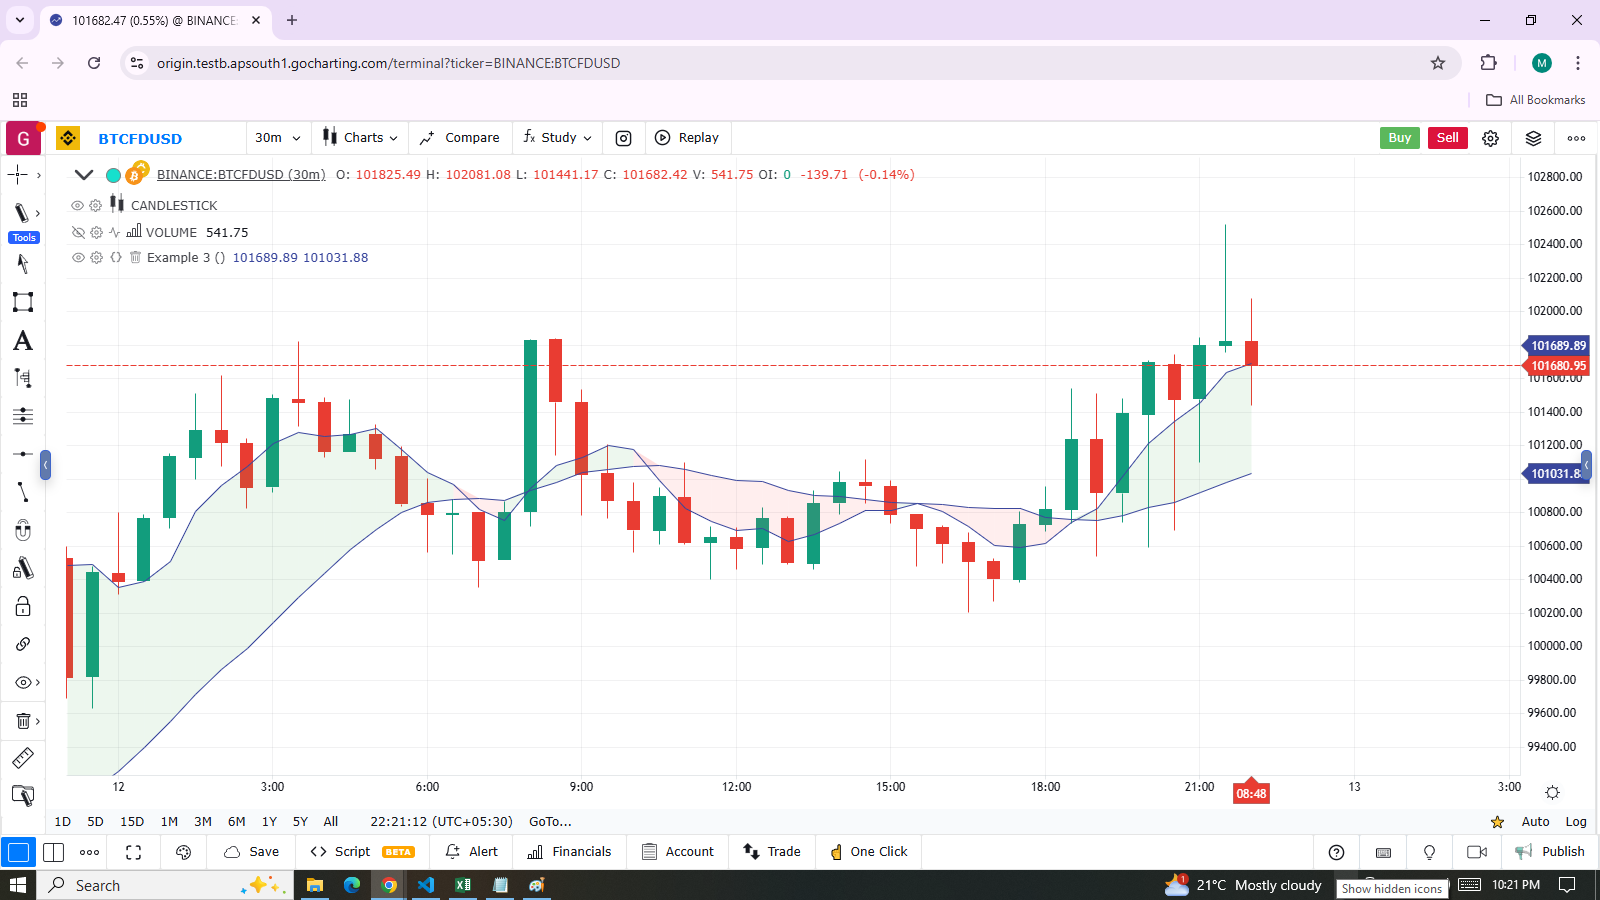
The color parameter of the fill() function accepts a “series color” argument, meaning the fill’s color can vary across chart bars. For example, this code fills the space between two moving average plots with 90% transparent green or red colors, depending on whether ma1 is above ma2:

indicator("Example 3", overlay = true)

//@variable The 5-bar moving average of `close` prices.
float ma1 = talib.sma(close, 5)
//@variable The 20-bar moving average of `close` prices.
float ma2 = talib.sma(close, 20)

//@variable The 90% transparent color of the space between MA plots. Green if `ma1 > ma2`, red otherwise.
color fillColor = ma1 > ma2 ? color.new(color.green, 0.1) : color.new(color.red, 0.1)

//@variable The ID of the `ma1` plot for use in the `fill()` function.
ma1PlotID = plot(ma1, "5-bar SMA")
//@variable The ID of the `ma2` plot for use in the `fill()` function.
ma2PlotID = plot(ma2, "20-bar SMA")

// Fill the space between the `ma1PlotID` and `ma2PlotID` using the `fillColor`.
fill(ma1PlotID, ma2PlotID, color= fillColor, title = "SMA plot fill")