Simple Moving Average (SMA) in GoCharting
What is a Moving Average?
A Moving Average (MA) is a widely used technical analysis tool that smooths out price data by creating a constantly updated average price. The Simple Moving Average (SMA) is the most basic type of moving average. It calculates the average of a selected range of prices, usually the closing price, over a defined number of periods.
Key Points:
- Lagging Indicator: Since it uses past data, the SMA is considered a lagging indicator.
- Smoothing: The primary goal is to remove short-term fluctuations and reveal the underlying trend.
- Common Periods: Traders often use 50-day, 100-day, and 200-day SMAs.
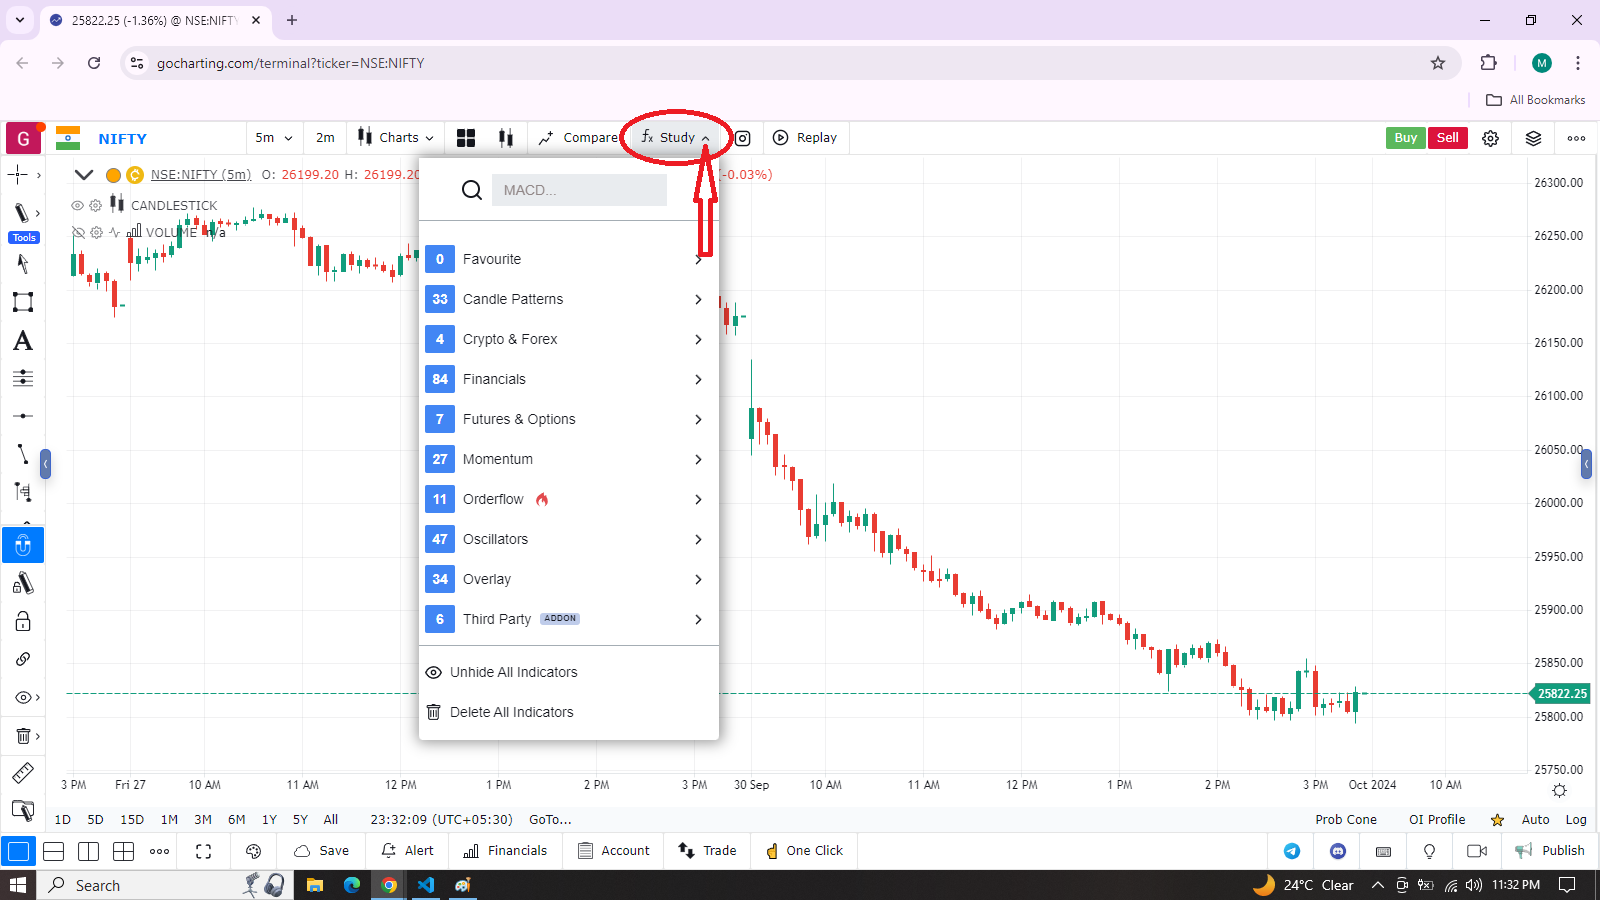
Steps to Apply the Simple Moving Average (SMA) Indicator in GoCharting
-
Open the GoCharting platform and load a chart of your choice.
-
Access the Indicator Panel:
- Click on the “fx” study button at the top of the screen to open the indicator list.
-
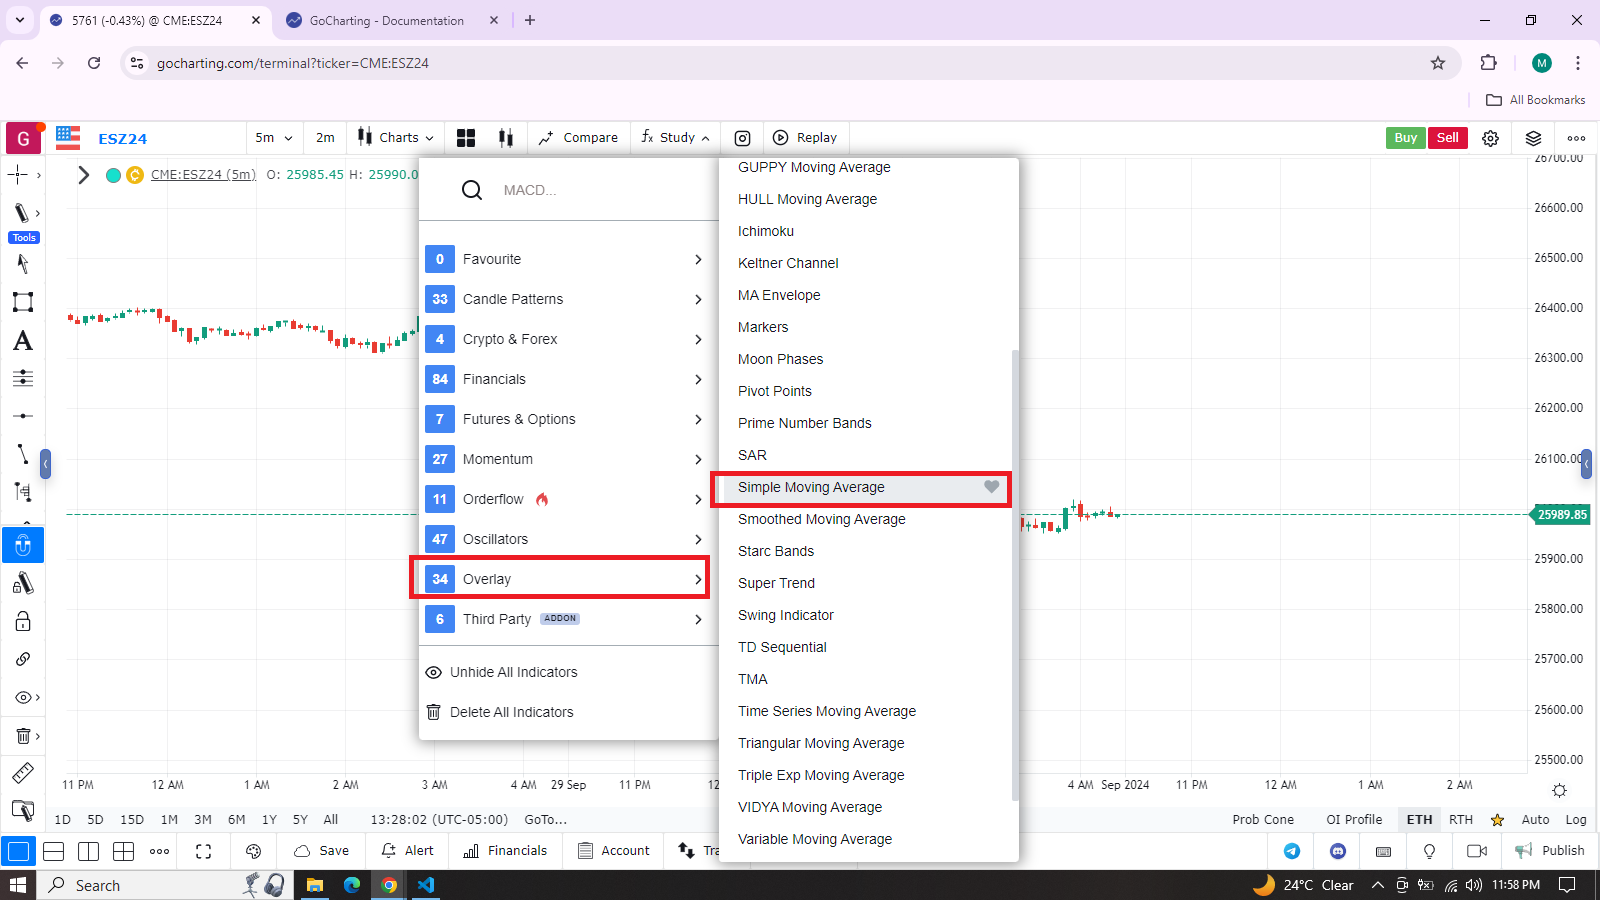
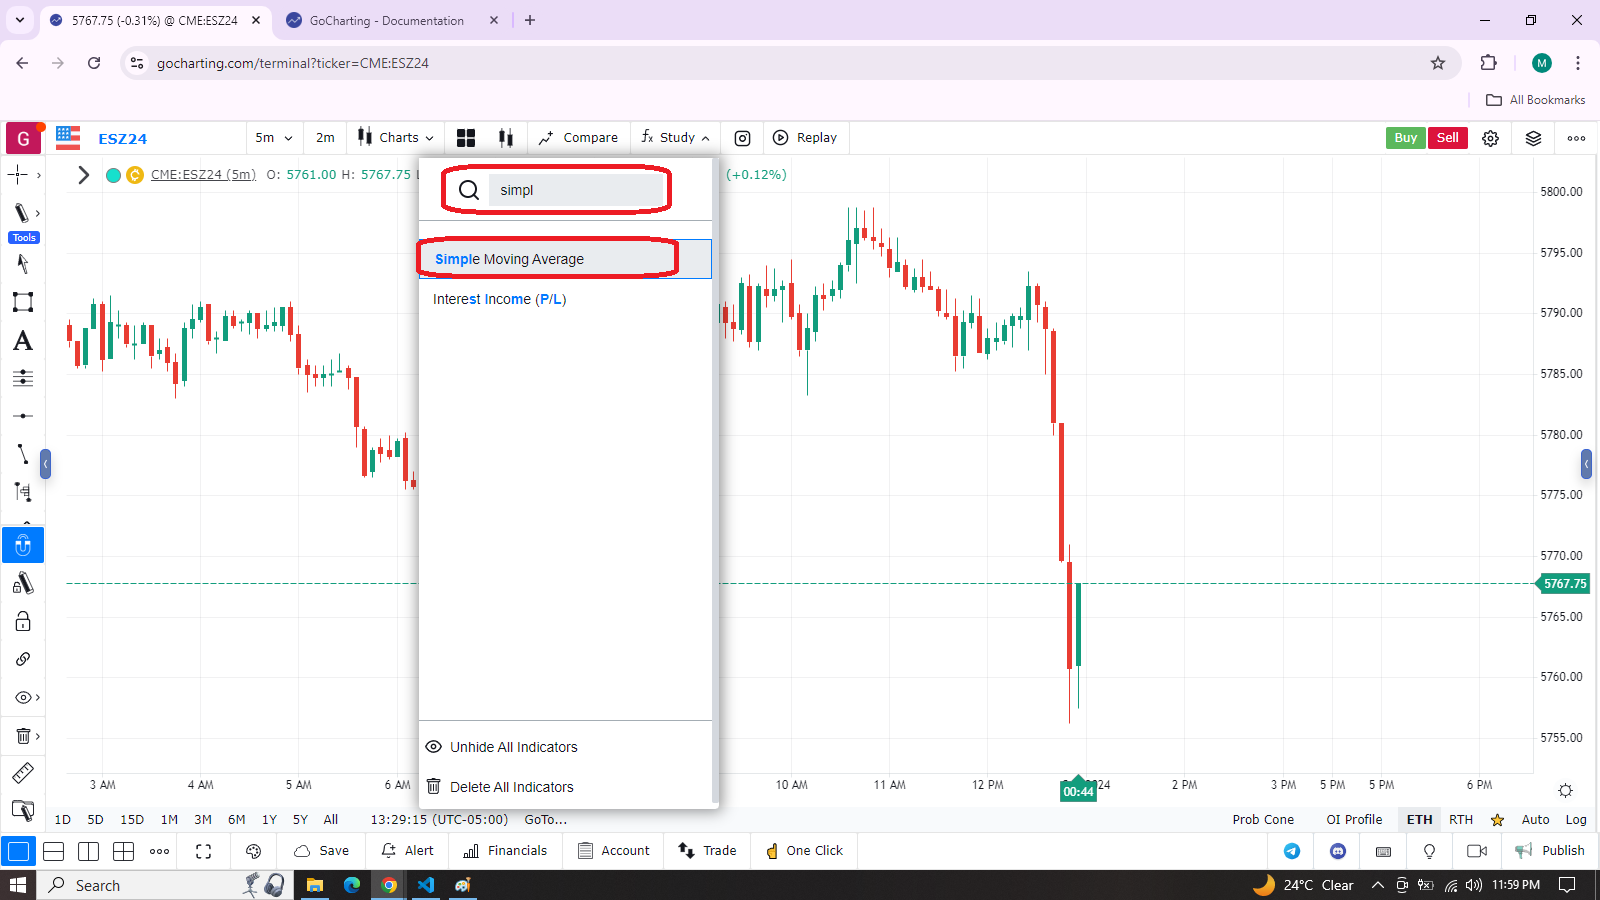
Search for the Simple Moving Average:
- You can either scroll down to the Overlay category or type “Simple Moving Average” in the search bar to locate the indicator.
-
Apply the Simple Moving Average to the Chart:
- Once located, click on Simple Moving Average to apply it to your chart.
-
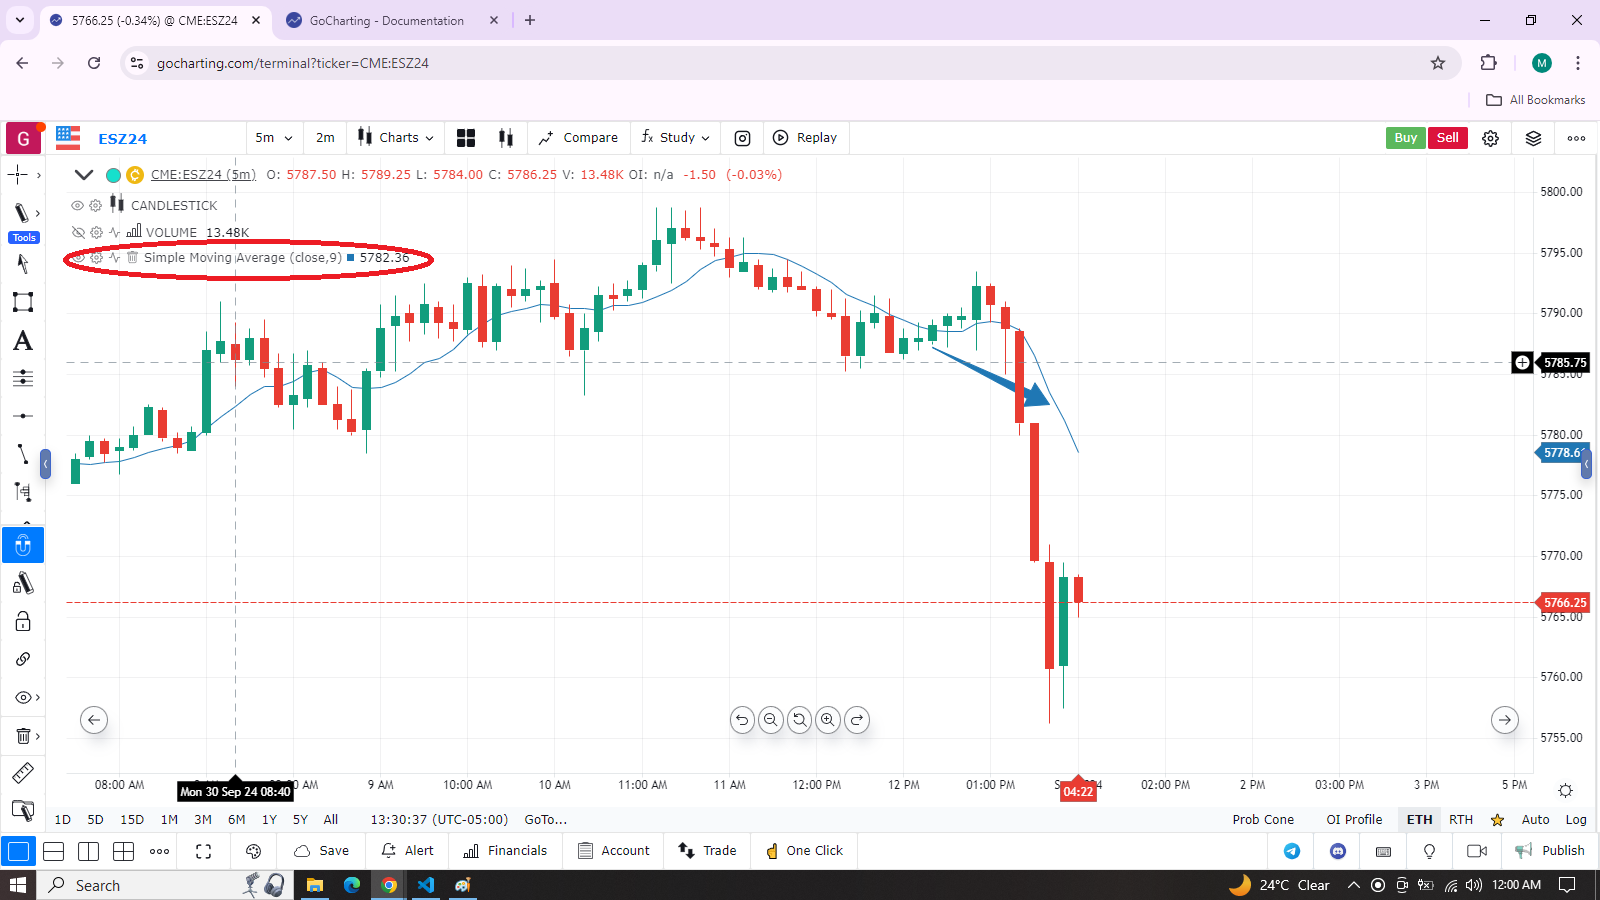
Customization:
- You can modify the number of periods and the type of price used in the calculation (close, open, high, low, etc.). For example, the default might be set to a 9-period SMA, but you can adjust this according to your trading strategy.
Explanation of SMA Components
-
SMA Line: The line represents the average price of the selected time period. As the price moves, the SMA line adjusts to reflect the new average.
-
Periods: The number of periods used for calculating the SMA can be customized. A smaller period (e.g., 10-period) reacts faster to price changes but may generate more false signals, while a larger period (e.g., 200-period) is smoother but reacts slower to price movements.
Example of Using the SMA for Trading
- Crossovers: Traders often look for crossovers between a short-term SMA and a long-term SMA. When the short-term SMA crosses above the long-term SMA, it is a buy signal (Golden Cross), while a cross below is a sell signal (Death Cross).
- Support and Resistance: SMAs can act as dynamic support and resistance levels. For example, if the price is above the 200-day SMA, it suggests the market is in an uptrend.