RSI Indicator in GoCharting
What is the Relative Strength Index (RSI)?
The Relative Strength Index (RSI) is a momentum oscillator that measures the speed and change of price movements. It ranges from 0 to 100 and is commonly used to identify overbought and oversold conditions in a market.
- Overbought: RSI above 70 often indicates a market is overbought and may be due for a correction.
- Oversold: RSI below 30 suggests the market is oversold, and a reversal to the upside may be on the horizon.
RSI is typically calculated using a 14-period time frame, but traders can adjust the period based on their strategy.
Steps to Apply the RSI Indicator in GoCharting
-
Navigate to the GoCharting platform and load a chart of your choice
-
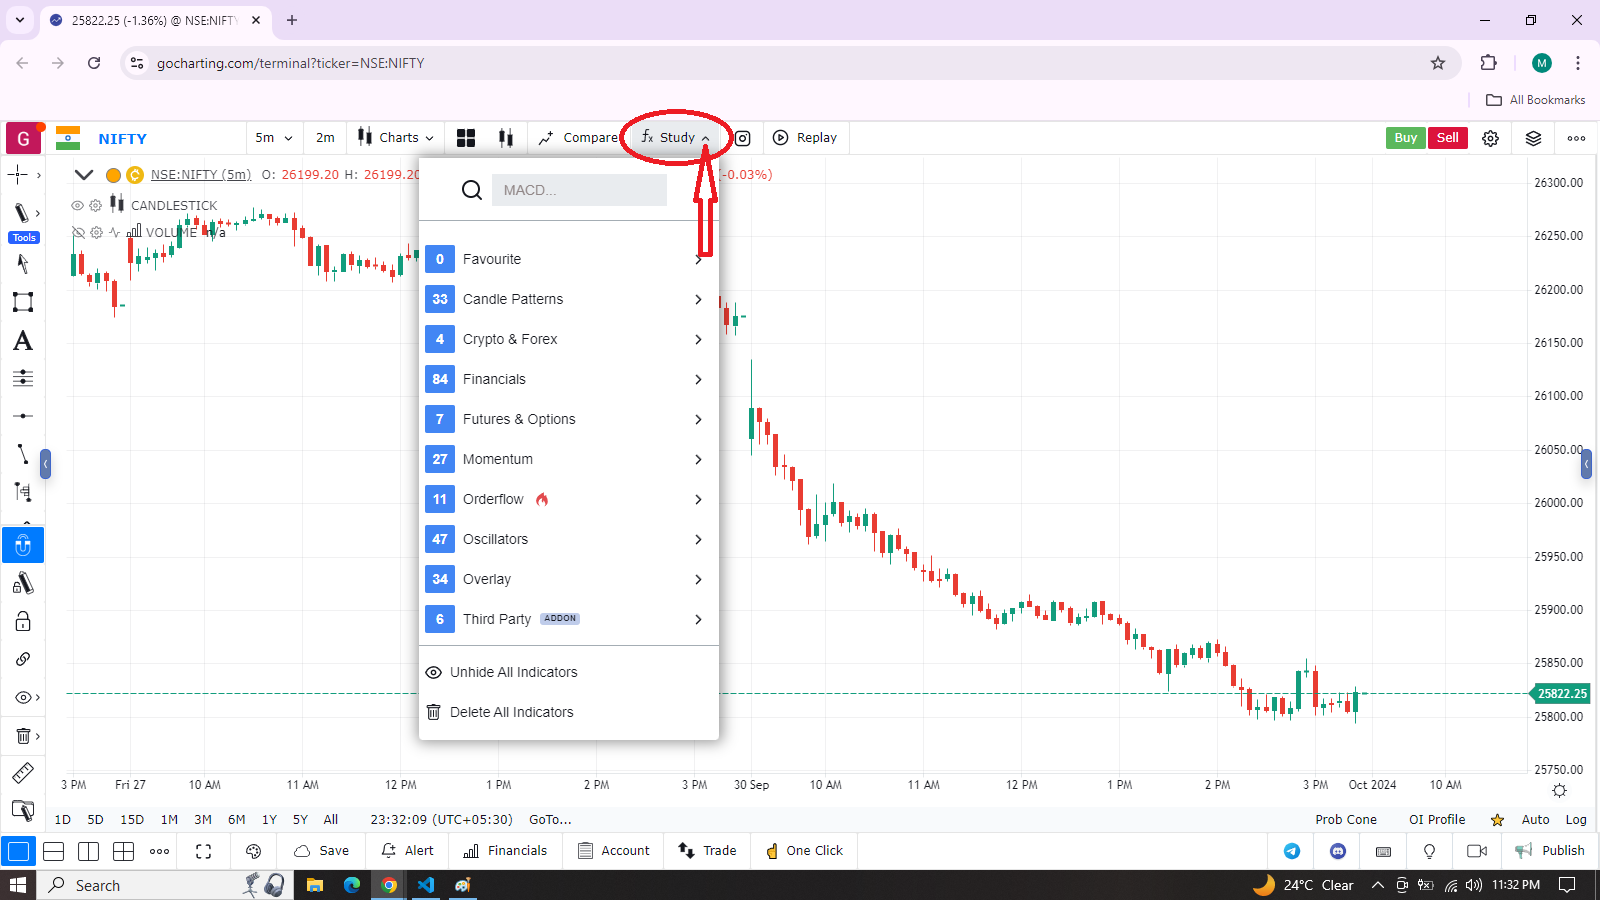
Access the Indicator Panel:
- Click on the “fx” study button at the top of the screen (as shown in the screenshot). This will open a list of available indicators.
-
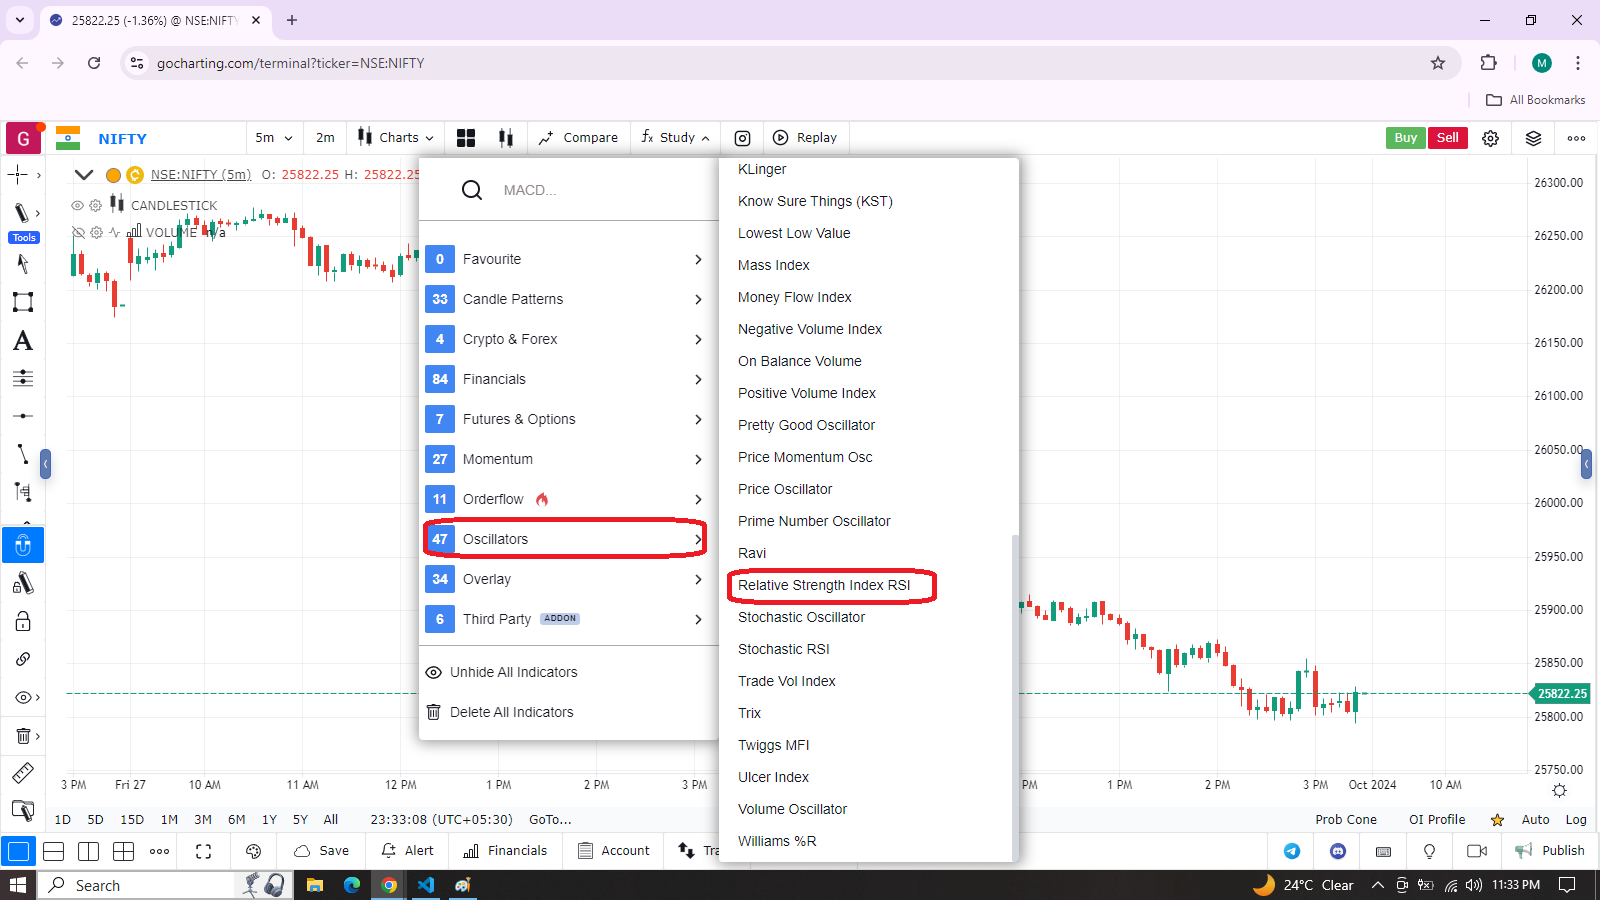
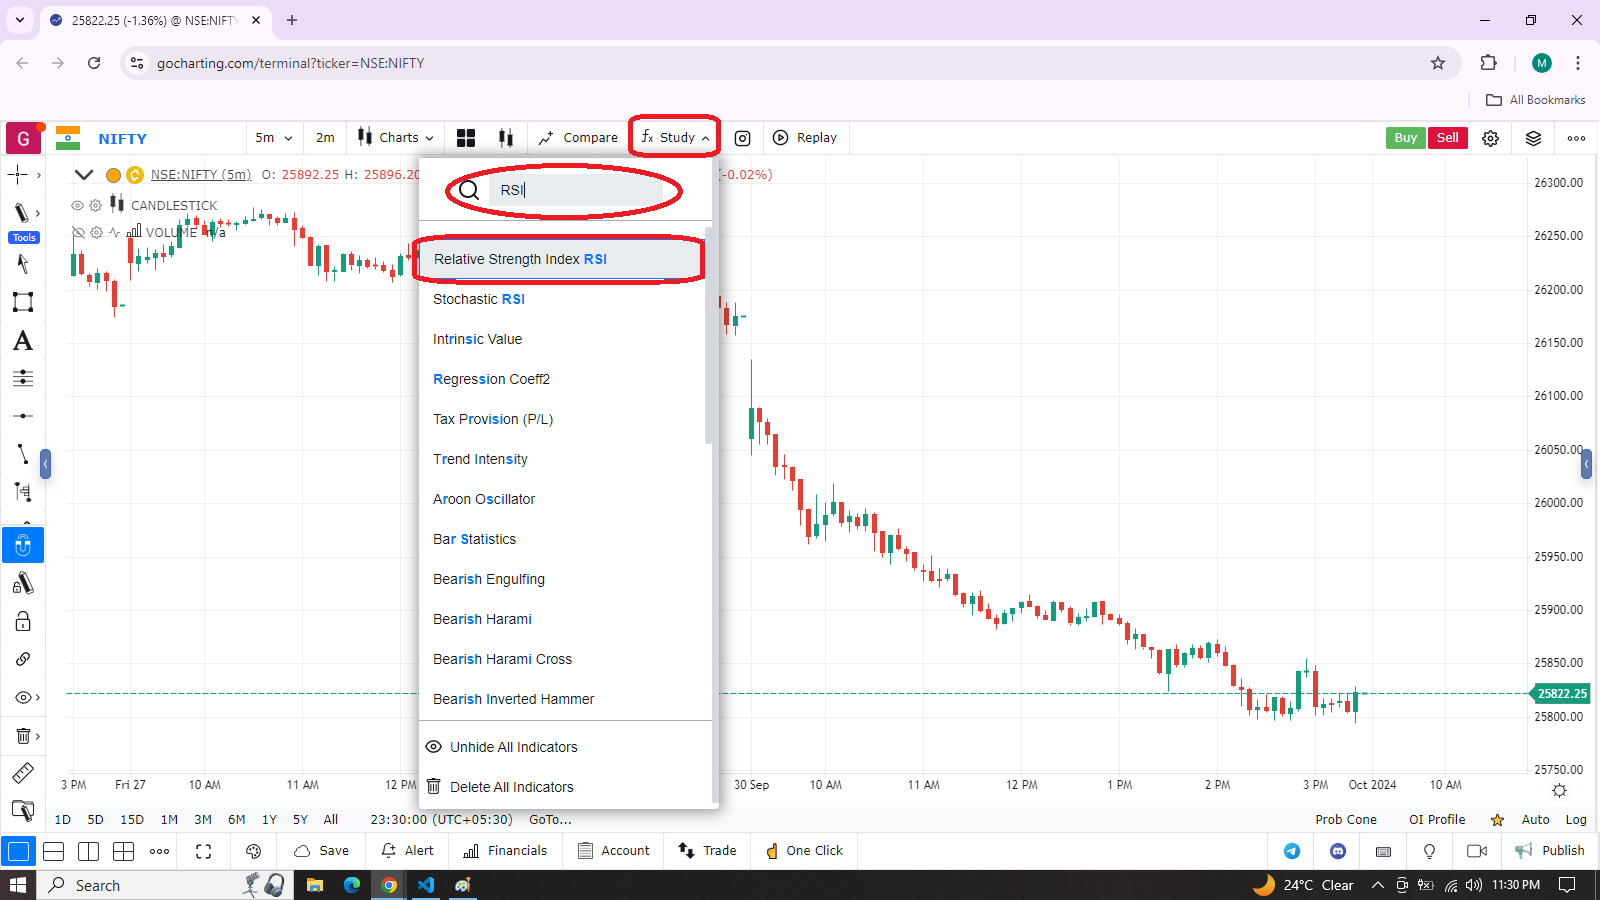
Search for RSI:
- You can either scroll down to the Oscillator category or type “RSI” in the search bar to find the Relative Strength Index RSI indicator.
- Once found, click on the RSI option to apply it to the chart.
-
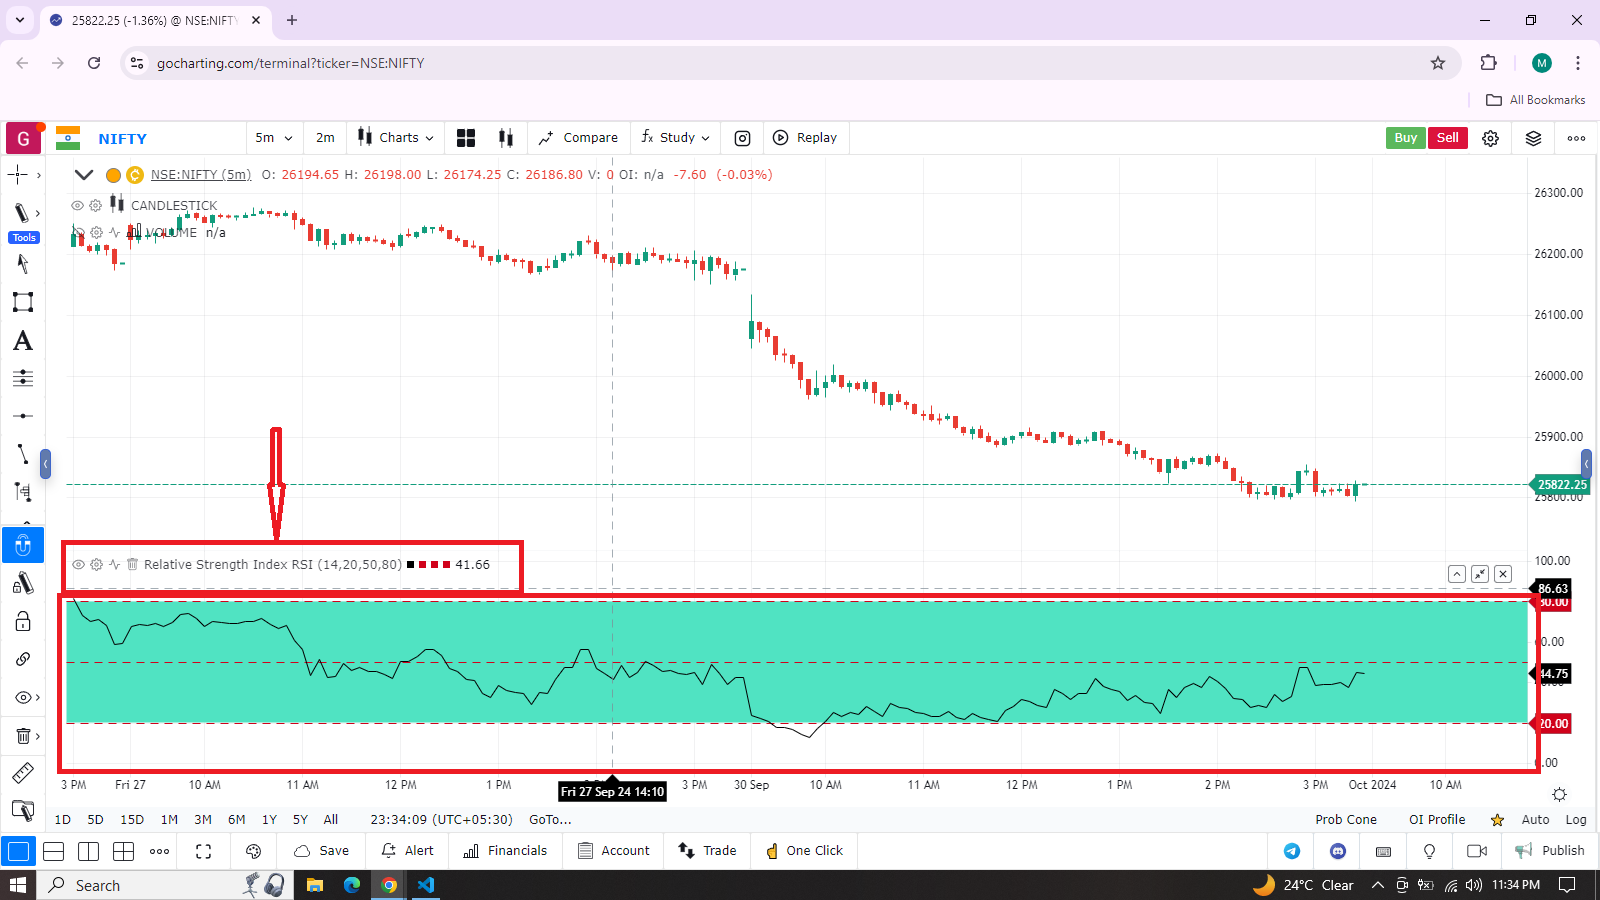
RSI Indicator on the Chart:
- The RSI will now appear below the main price chart (as seen in the second screenshot). The default RSI parameters are often set to 14-period, with overbought and oversold levels at 80 and 20, respectively.
Explanation of RSI Components
-
RSI Line: The black line that moves within the RSI oscillator window reflects the momentum of the price. When the line approaches the upper or lower extremes (80 or 20), it indicates the asset’s price may be overbought or oversold.
-
Overbought and Oversold Levels: These are marked at 80 (red dashed line) and 20 (red dashed line), respectively. A value above 80 is an indication of an overbought condition, and a value below 20 is an indication of an oversold condition.
Customizing the RSI
You can customize the parameters of the RSI:
- Period: Adjust the default 14-period based on your trading style (e.g., a shorter period for more sensitivity, a longer period for smoother results).
- Overbought/Oversold levels: You can change these levels from the default 80/20 to 70/30 if you prefer a more traditional setup.