📘 Orderflow Variables in Lipi Script
Orderflow analysis provides traders with a deeper understanding of market dynamics by examining who is in control — buyers or sellers — and how aggressively they are acting. Instead of relying solely on price and volume, orderflow reveals the intensity and direction of trading pressure within each candle.
Lipi Script offers a robust set of orderflow. variables that enable you to access and visualize detailed trade-level information, including the number of trades, aggressor direction, volume imbalance, and delta strength. These variables are optimized for use on footprint on the GoCharting platform, where orderflow data is available.
These tools are essential for identifying concepts like absorption, exhaustion, divergence, and imbalance, allowing for highly informed trading decisions.
🔧 Syntax
All orderflow variables follow this structure:
orderflow.<variable_name>Example:
plot(orderflow.delta)📋 Available Orderflow Variables
| Variable | Description |
|---|---|
orderflow.trades | Total number of trades in the current bar. |
orderflow.buy | Number of aggressive buy trades. |
orderflow.sell | Number of aggressive sell trades. |
orderflow.buyvolume | Total volume of all buy trades in the bar. |
orderflow.sellvolume | Total volume of all sell trades in the bar. |
orderflow.delta | Buy volume minus sell volume. |
orderflow.maxdelta | Peak positive delta within the bar (strongest point of buying pressure). |
orderflow.mindelta | Peak negative delta within the bar (strongest point of selling pressure). |
orderflow.cothigh | COTHigh — cumulative delta tracked from the point where price makes or retests a high. |
orderflow.cotlow | COTLow — cumulative delta tracked from the point where price makes or retests a low. |
🧪 Basic Usage Examples
📊 Plot Delta
indicator("Delta Plot", overlay=false)

barColor = orderflow.delta >= 0 ? color.green : color.red

plot(orderflow.delta, color=barColor, title="Delta", style=plotStyle.bar)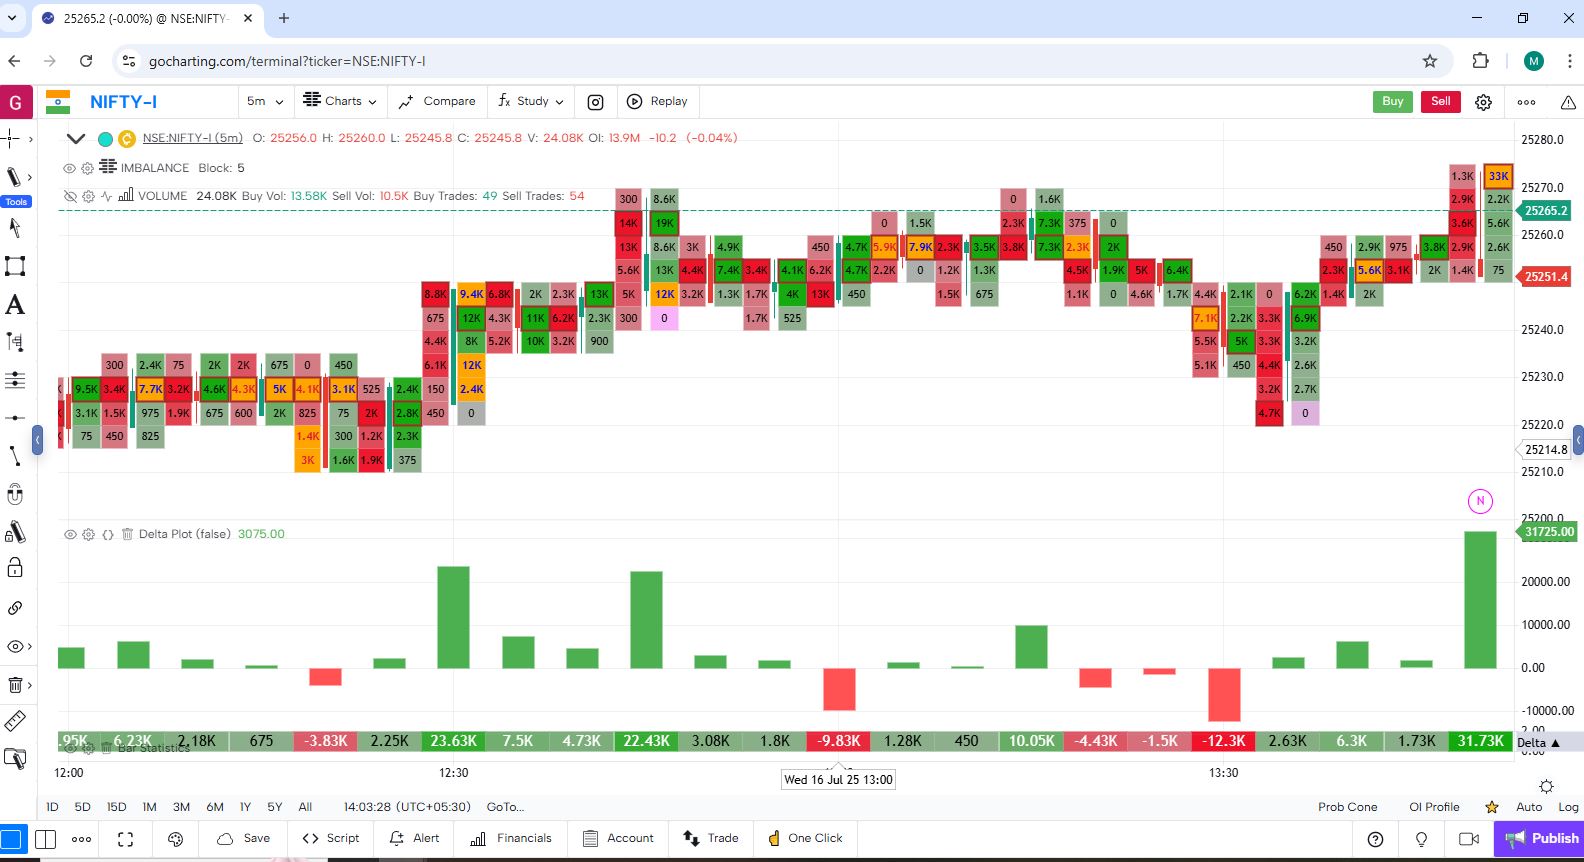
📊 Plot Cumulative Volume Delta(CVD)
indicator("Cumulative Volume Delta (9:15 to 15:30)", overlay=false)

// Use your delta input
delta = orderflow.delta

// Define session time range (Indian stock market hours)
inSession = (hour == 9 and minute >= 15) or (hour > 9 and (hour < 15 or (hour == 15 and minute <= 30)))

// Identify the session start
isSessionStart = (hour == 9 and minute == 15)

// Persistent cumulative delta
static int cumDelta = na

if isSessionStart {
    cumDelta := delta
} else if inSession {
    cumDelta := cumDelta + delta
} else {
    cumDelta := na
}
plot(cumDelta, color=color.teal, title="Cumulative Orderflow Delta")
// Add zero horizontal line
hline(0, title="Zero Line", color=color.red, style=hlineStyle.dotted)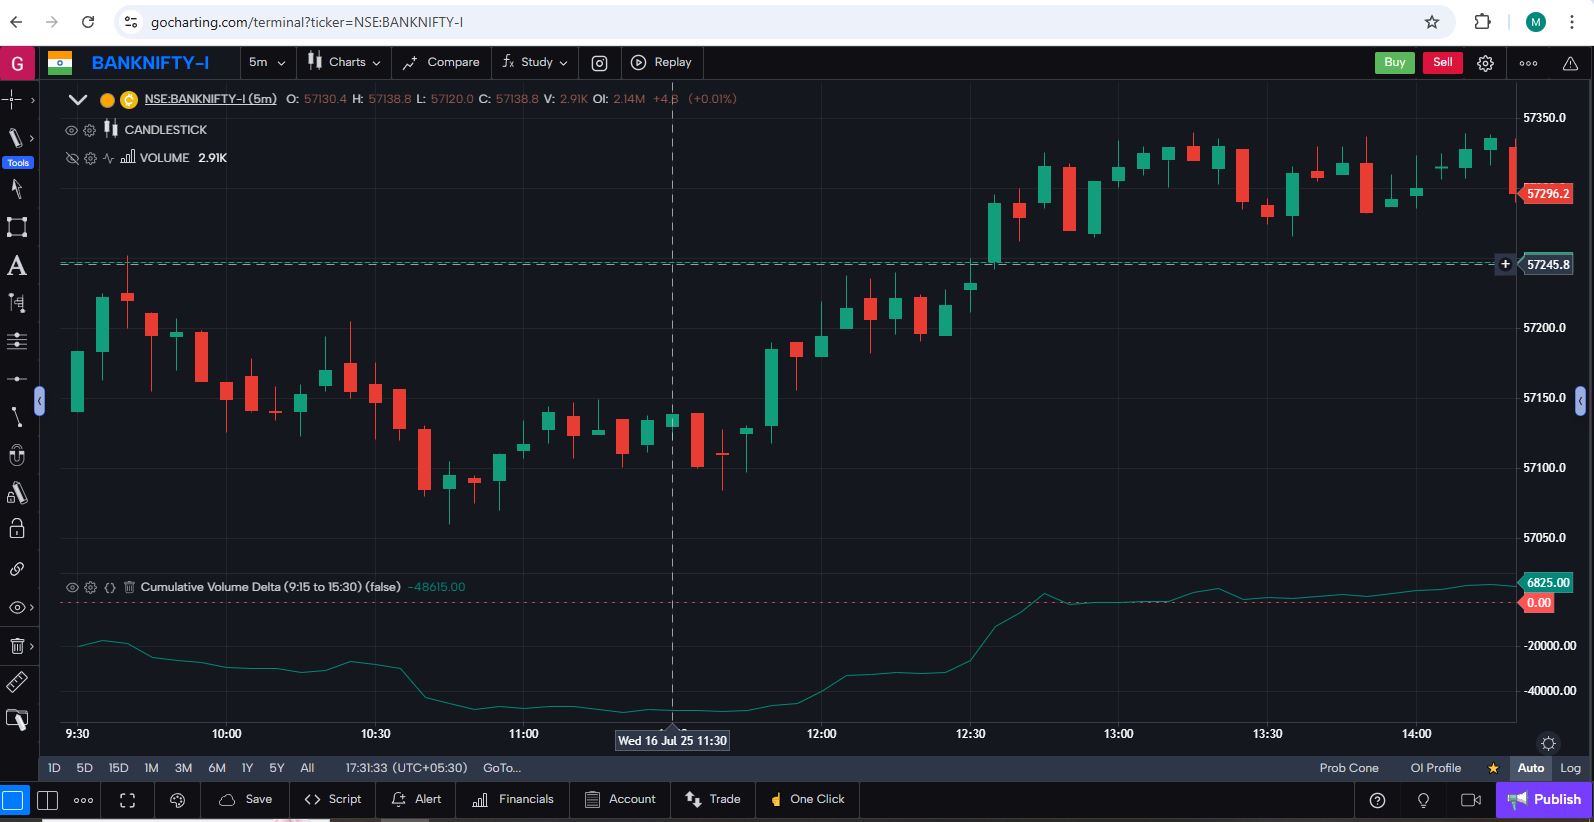
📊 Plot Buy and Sell Volume
indicator("Buy/Sell Volume", overlay=false)

plot(orderflow.buyvolume, color=color.green, title="Buy Volume")
plot(orderflow.sellvolume, color=color.red, title="Sell Volume")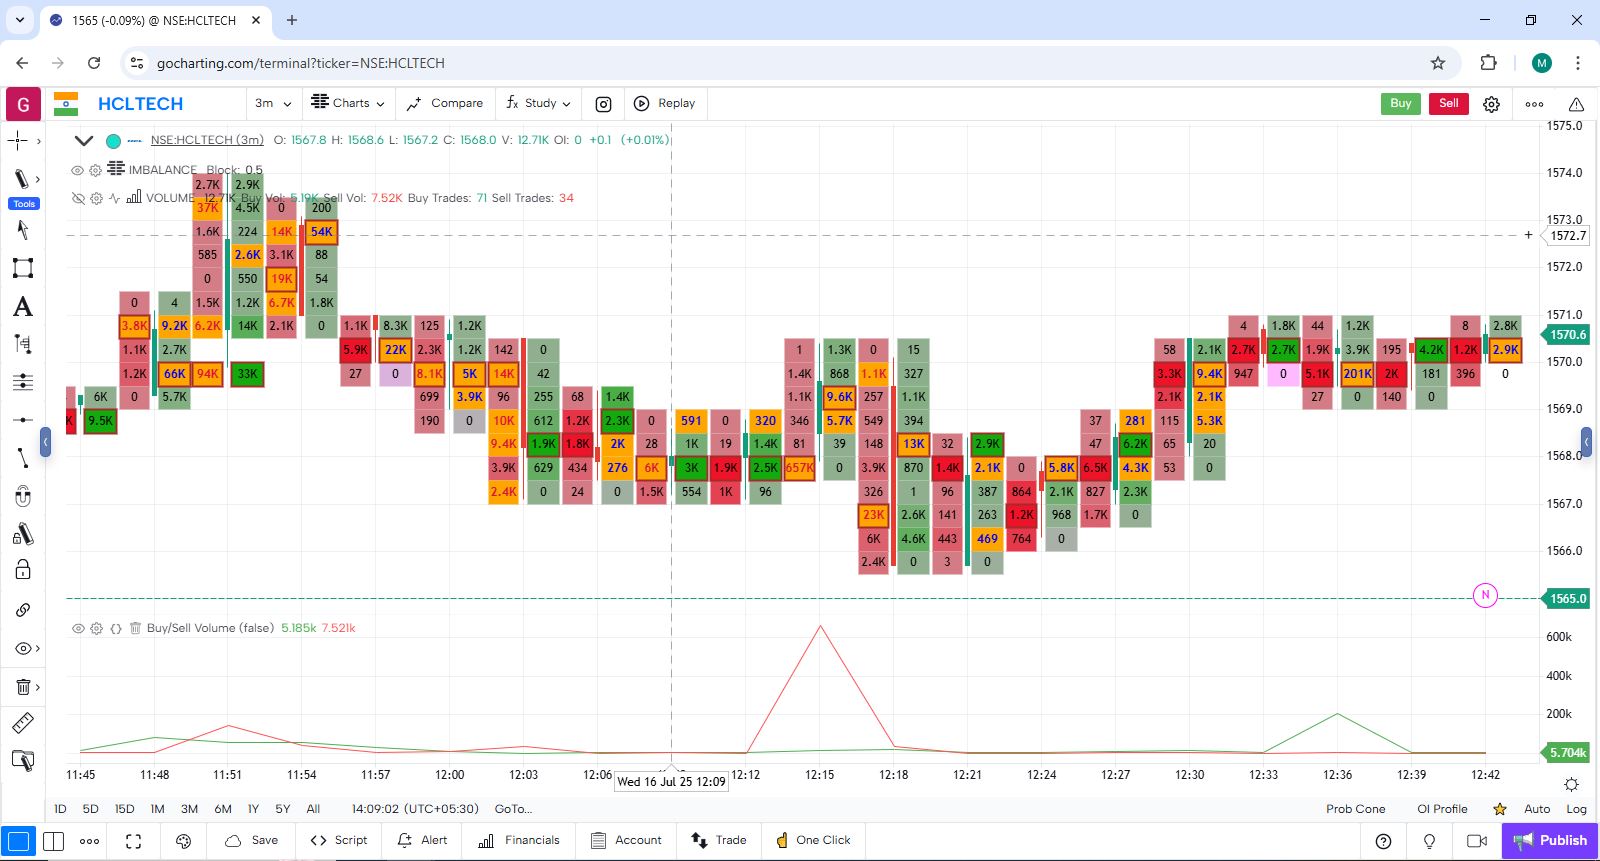
🔍 Visualize Number of Buy and Sell Trades
indicator("Buy/Sell Trades", overlay=false)

plot(orderflow.buy, color=color.green, title="Buy Trades")
plot(orderflow.sell, color=color.red, title="Sell Trades")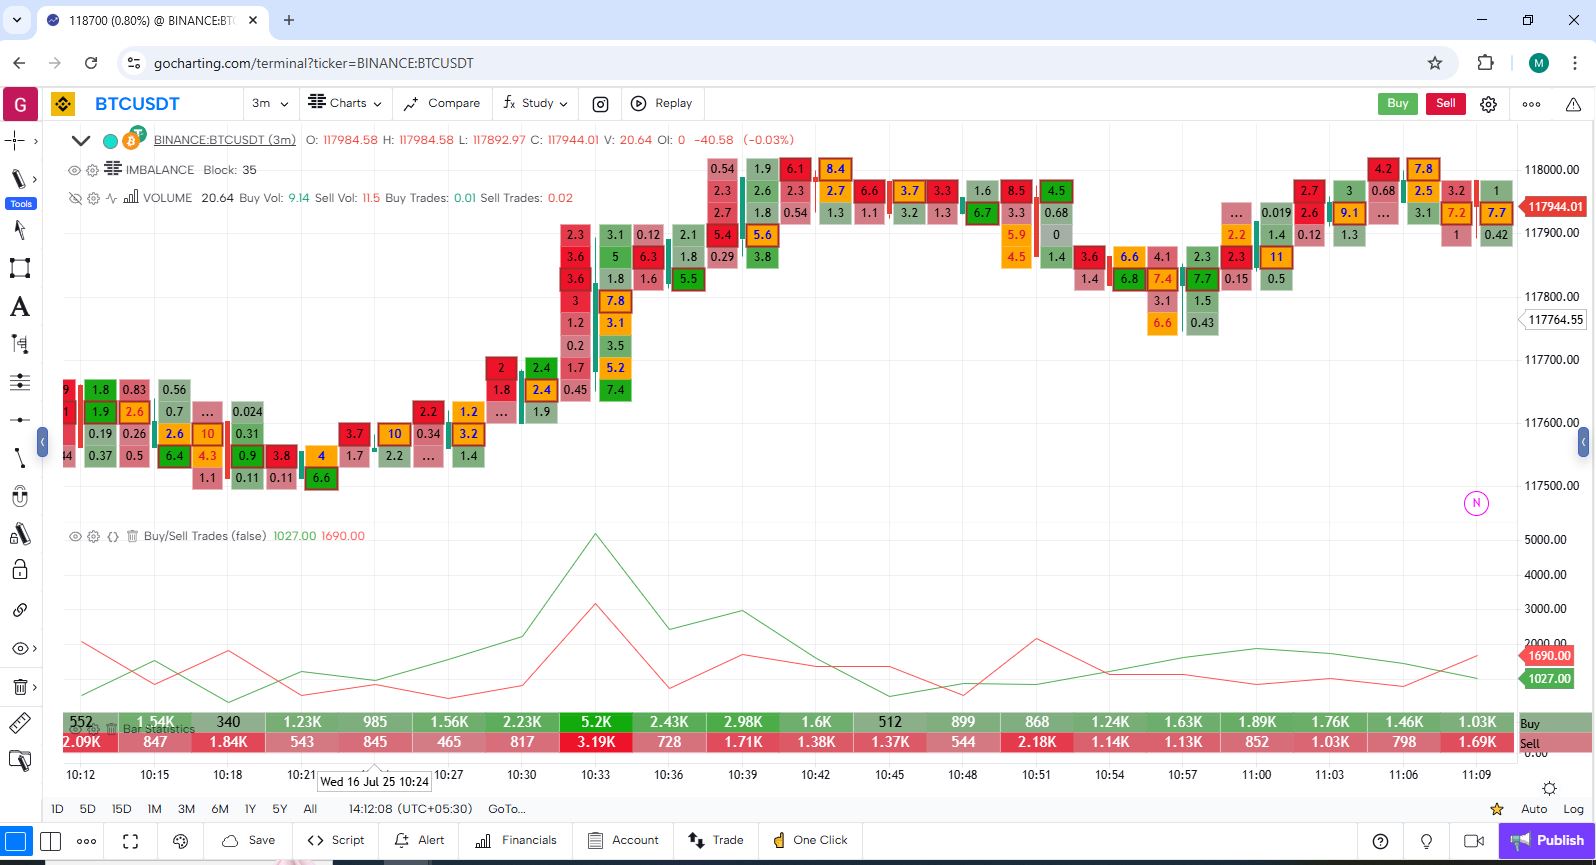
📈 Advanced Concepts
🟢 Highlight Strong Buy Pressure with Max Delta
indicator("Strong Buy Pressure", overlay=true)

strongBuy = orderflow.maxdelta > 10000
bgcolor(strongBuy ? color.new(color.green, 0.2) : na)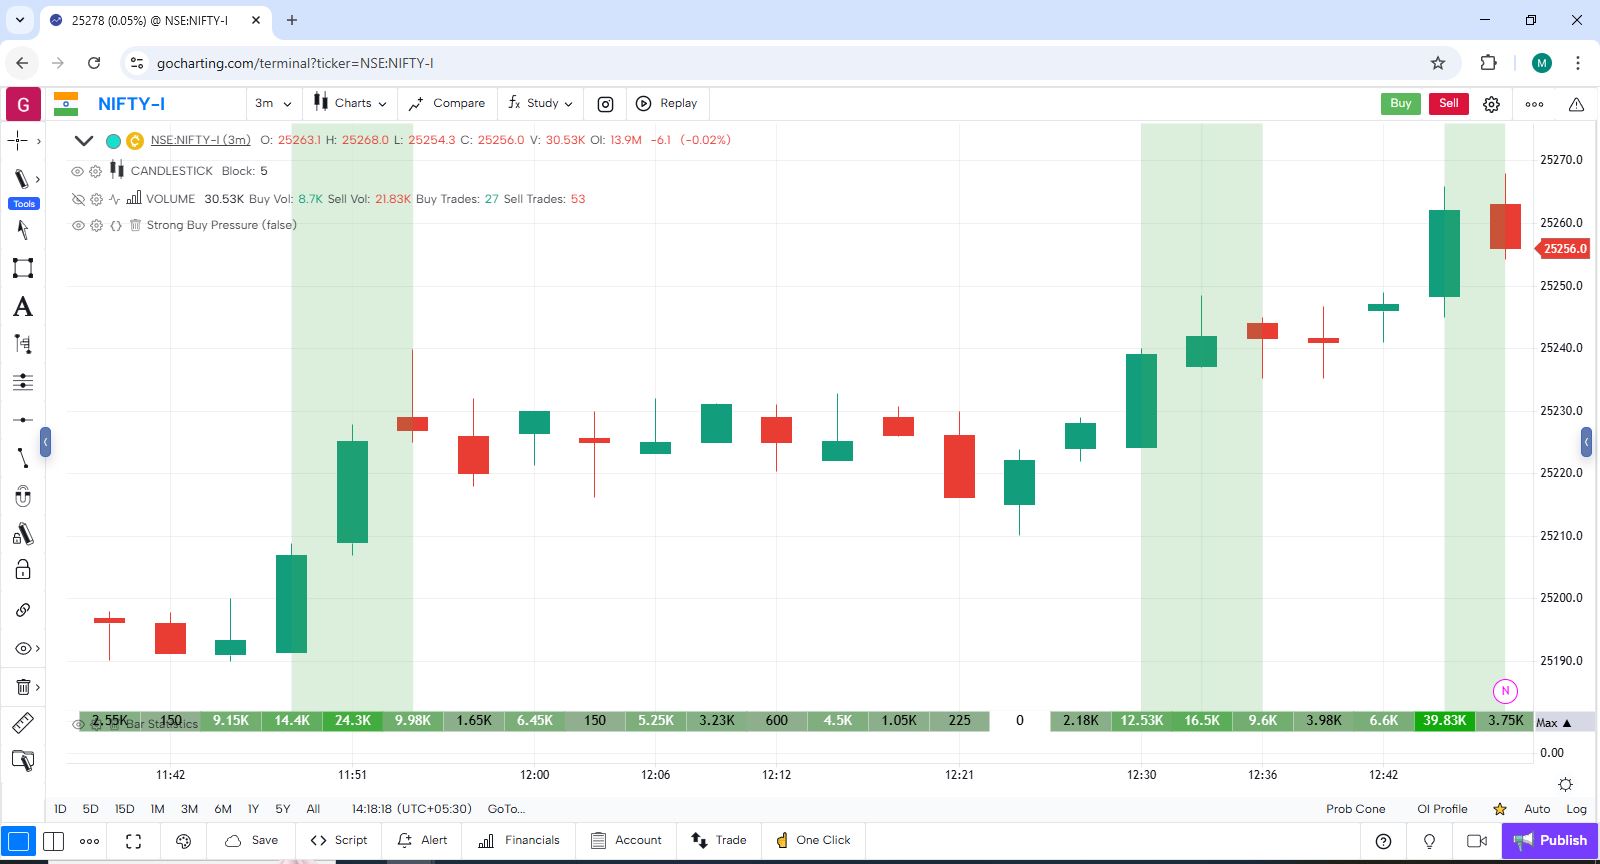
🔴 Highlight Strong Sell Pressure with Min Delta
indicator("Strong Sell Pressure", overlay=true)

strongSell = orderflow.mindelta < -100000
bgcolor(strongSell ? color.new(color.red, 0.2) : na)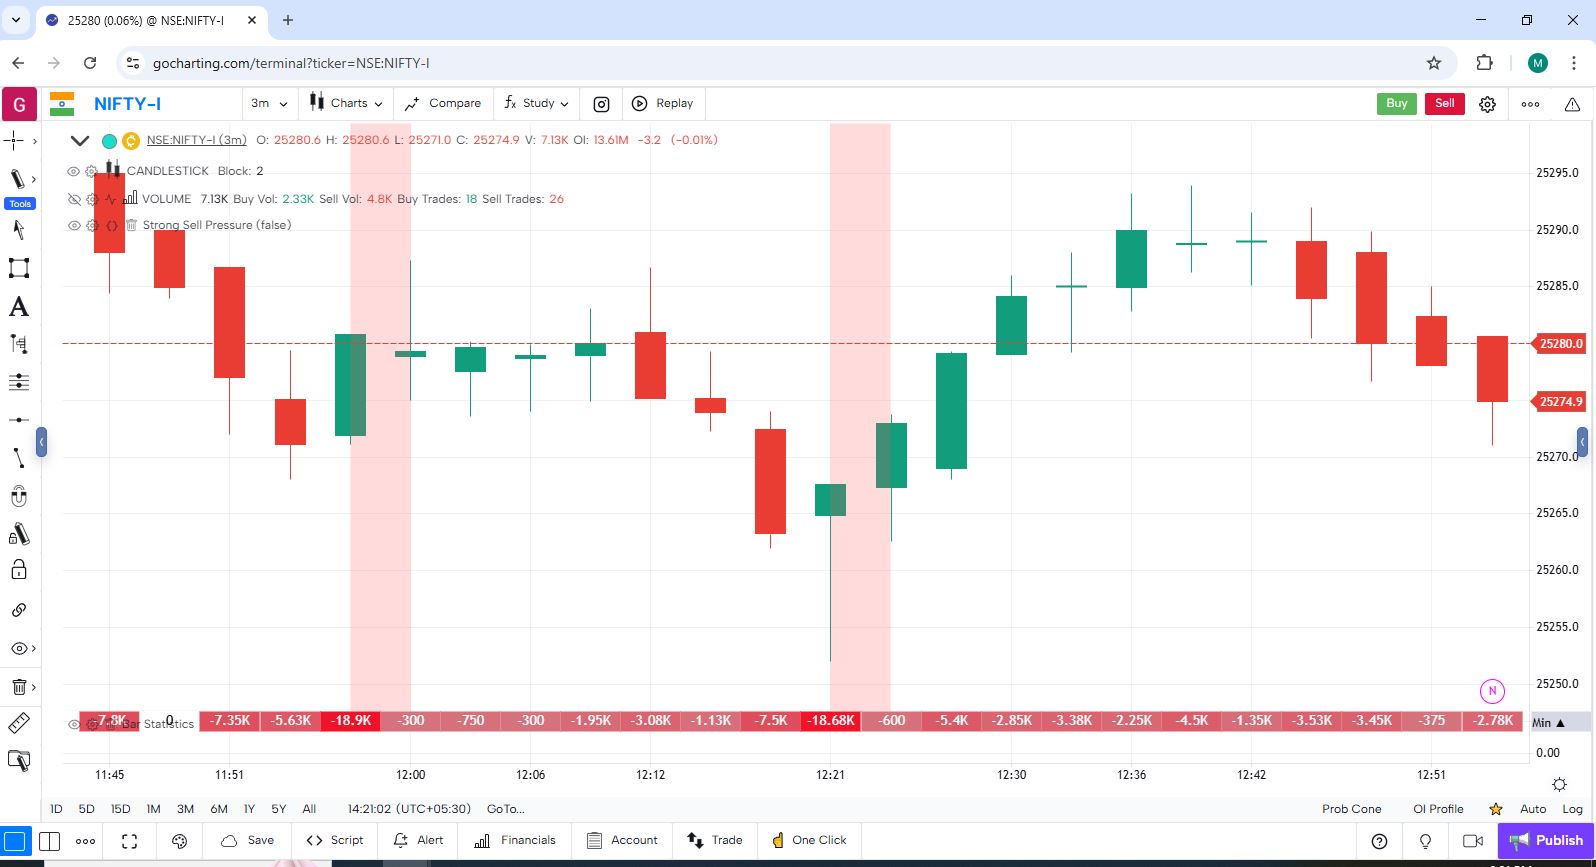
🔵 Plot COTHigh
orderflow.cothigh tracks cumulative delta from the moment price hits or revisits a high.
indicator("COTHigh Example", overlay=false)

plot(orderflow.cothigh, title="COTHigh", color=color.red)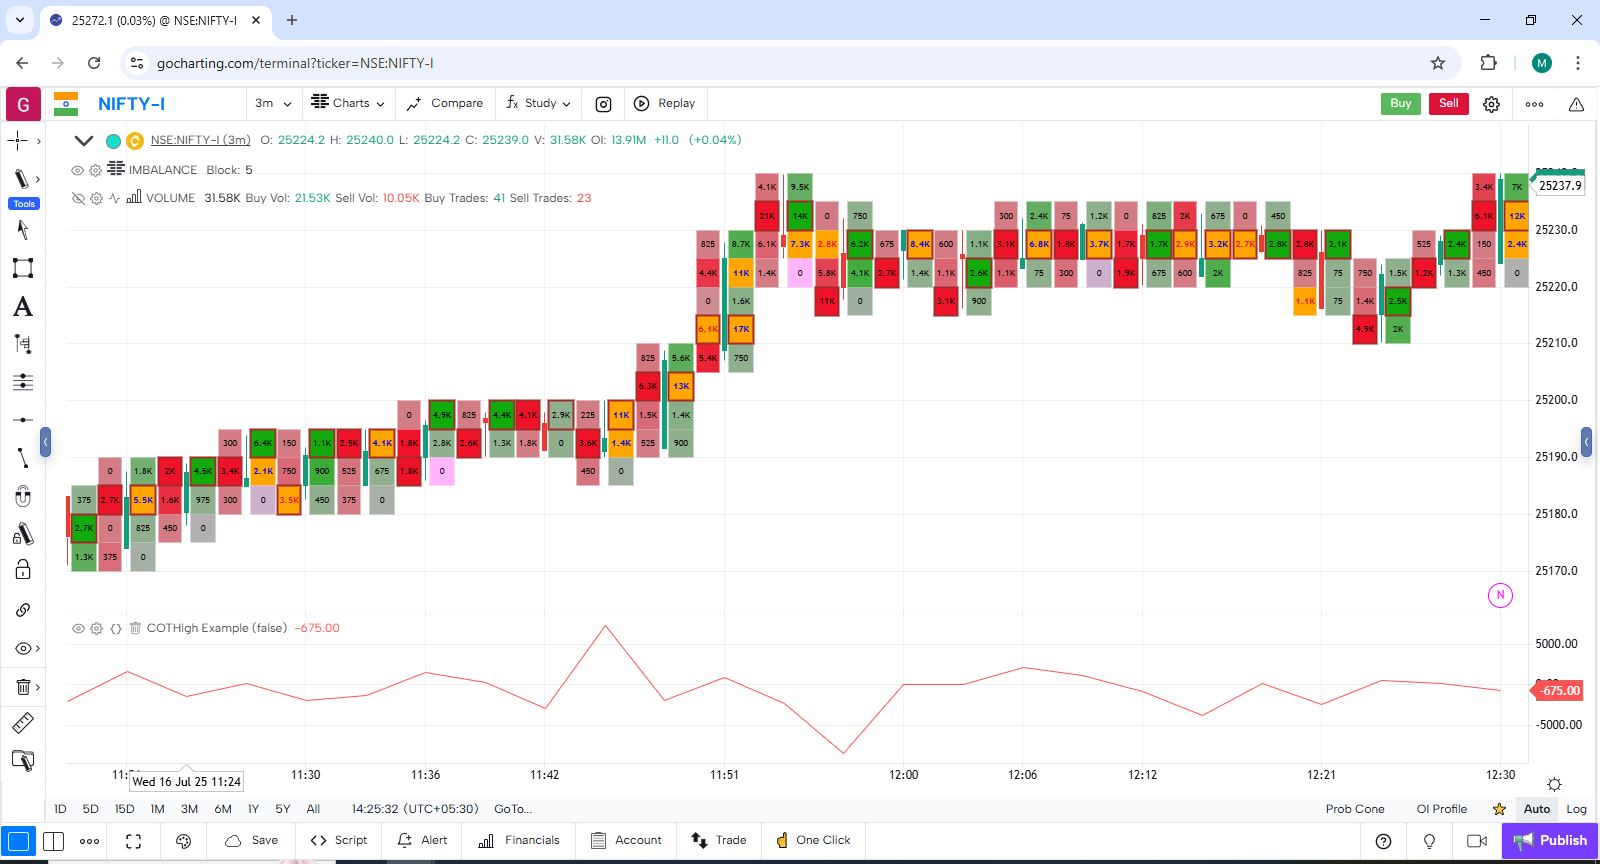
🟠 Plot COTLow
orderflow.cotlow tracks cumulative delta from the moment price hits or revisits a low.
indicator("COTLow Example", overlay=false)

plot(orderflow.cotlow, title="COTLow", color=color.green)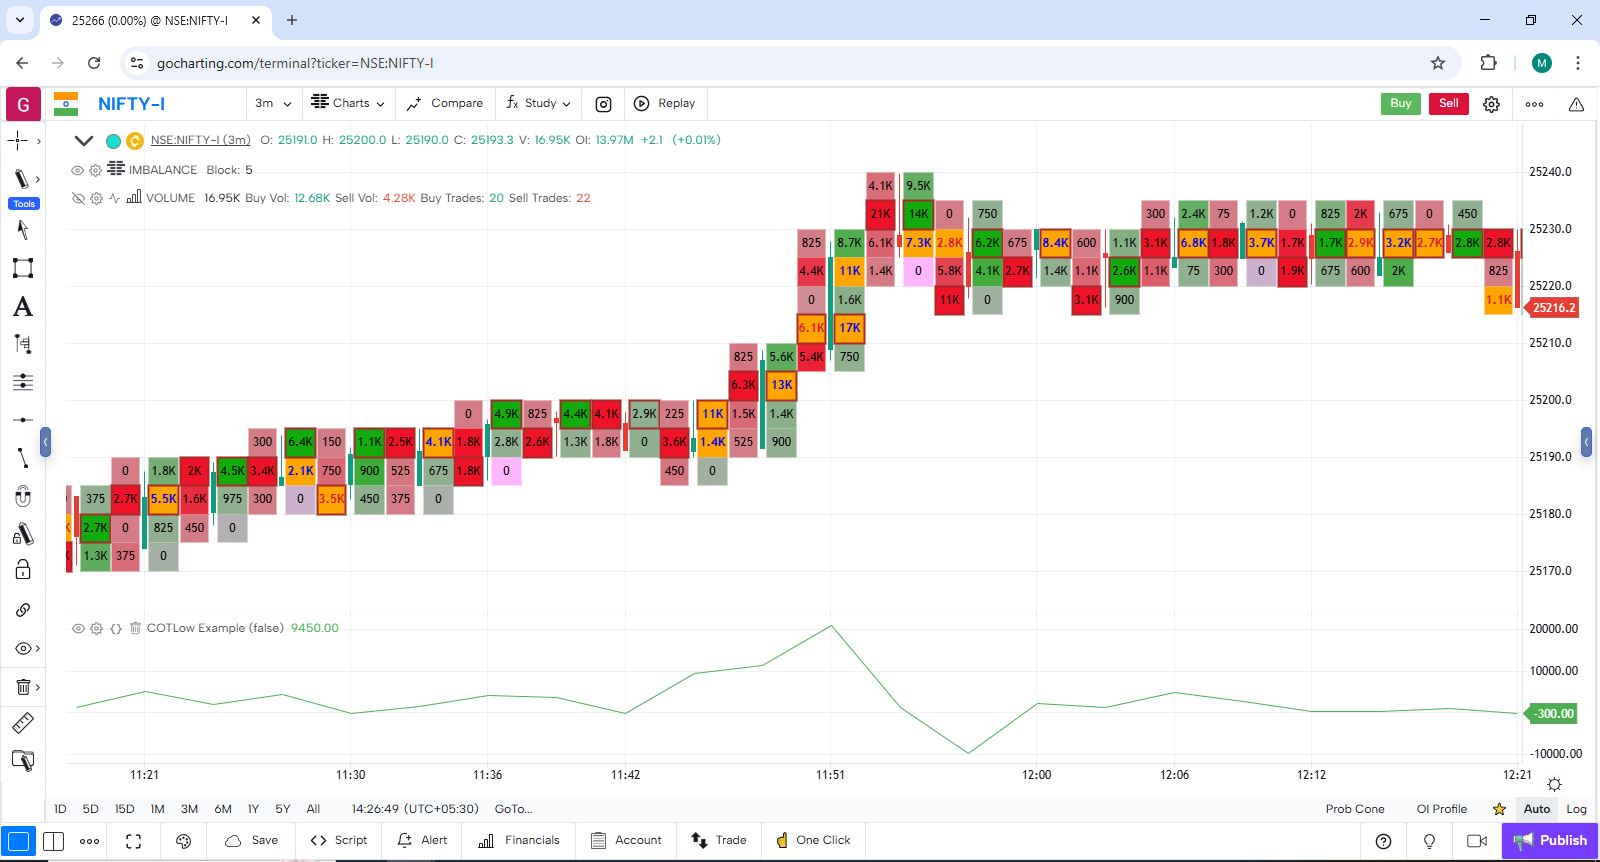
🧠 Tips and Best Practices
- Use delta-based metrics (
delta,maxdelta,mindelta) to gauge real-time buying or selling pressure beyond what price alone can show. - Combining orderflow with price action can help detect exhaustion, absorption, or hidden divergences.
buyvolumeandsellvolumeprovide a more detailed view of aggressor activity compared to traditional volume.- Sharp increases in
tradesorbuy/sellcounts can indicate momentum ignition or event-driven spikes. - Orderflow imbalances are most meaningful during breakout attempts or near support/resistance zones.
- Large differences between
maxdeltaandmindeltawithin the same candle may reflect volatile or trapped conditions.